You are using an out of date browser. It may not display this or other websites correctly.
You should upgrade or use an alternative browser.
You should upgrade or use an alternative browser.
tradesmart
Experienced member
- Messages
- 1,286
- Likes
- 22
375 here we come......?!
tradesmart
Experienced member
- Messages
- 1,286
- Likes
- 22
tradesmart
Experienced member
- Messages
- 1,286
- Likes
- 22
There's no serious buying on the dips so far; they're letting this market go lower before any big bounce imho.......
tradesmart
Experienced member
- Messages
- 1,286
- Likes
- 22
I'm seeing a bull flag.....opportunist long 370........stop loss engaged just in case...... 😉
tradesmart
Experienced member
- Messages
- 1,286
- Likes
- 22
Ah well, that bull flag turned bearish.....! should have stayed short....!
pulled for minimal damage.......sellers rool ok......?
ps - you were right Anmol - that turned into yet another decending triangle.......
edit - what a way to celebrate the rally's birthday - 170 points down with 25 mins to go - it's just like the good old days.......!
pulled for minimal damage.......sellers rool ok......?
ps - you were right Anmol - that turned into yet another decending triangle.......
edit - what a way to celebrate the rally's birthday - 170 points down with 25 mins to go - it's just like the good old days.......!
Last edited:
Good grief chaps - what happened there ?
Wish I had held onto my short from the first ND very early in the day - but closed for a miserable few points 'cos was too busy to monitor closely - didn't even go short on that triangle bo that we mentioned earlier 🙁
Go to start trusting the TA again !
TS - don't think the channels we've been trusting up till now are in vogue right now - whaddaya reckon CM?
edit - anyone remember me mentioning the daily chart and 50EMA a few weeks back when we were at 10,700 - at the time I reckoned we were due to pull down towards it and maybe breach.
Wish I'd had faith in myself and gone for a long hold short !
sigh !
tradesmart
Experienced member
- Messages
- 1,286
- Likes
- 22
Mom, you called it for sure......!
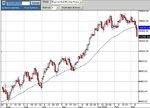
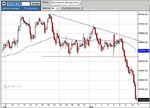
Support seems to count for nothing on days like this - almost a falling knife......(narrowly avoided getting cut...... 😡 )
Revised downtrend lines yet again..........! (possibly not worth a proverbial carrot, the way we're going......)
And that big, BIG H & S really did mean business.......any suggestions where the target could have been calculated from days ago...?!
I'm sure CM will let us know..... 😉
Attachments

Similar threads
- Replies
- 0
- Views
- 1K
- Replies
- 1
- Views
- 2K