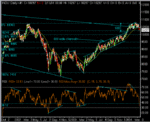
Dow Intraday charts 08/Mar - 12/Mar

Charts galore..........!

Thanks Mom/Frugi.......

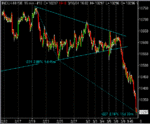
If I didn't keep my charts so cluttered up with so many extraneous cr*p lines, I might have been able to see the wood from the trees....... ;)

all so obvious now.......you just gotta focus on the main influential feature in the big picture........

and I guess we all see something slightly different....
 

Attachments

  • 10-03-04d.gif
    10-03-04d.gif
    16.1 KB · Views: 350
TS - I think the word we're all looking for is 'damn!'

or somfing a bit stronger perhaps :)
 
Bracke I do have my own indicator - RSI strength.... unless anyone knows of someone else that has read it/seen it before....
So many posts I've forgotten the questions :(
I'll edit them in later...
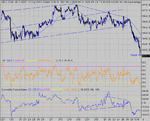
More of the same... very bizarre. No clues, no reason, no sense. As TS says, don't try to catch the knife. There will be plenty of time to get the longs in.... I make the triangle break target as 300. The T1 bear flag/mid run target is 250 ish, so a bit to go yet, especially as the triangle target was blown away. So much for yesterday's analysis... :(
Anyone know why I can only get 15 /20day's data? my settings say 40 days in the options setup :(
 

Attachments

  • dow 10-03-04 10.gif
    dow 10-03-04 10.gif
    39.6 KB · Views: 326
Same as yesterday... failure to break 64 and t/top with ND and down she went..... even the PD false bottom was there again .:(
Double target from the triangle (32) and the first pullback after the drop ( 31). T2 was the target from the second pullback. No excuses to close early.... Should have been 150 odd points...
 

Attachments

  • dow 10-03-04 1.gif
    dow 10-03-04 1.gif
    23.5 KB · Views: 314
Questions- Answers now..
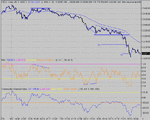
TS . The "days ago" target is clear in hindsight, but it WAS there all the time- marked on the 10 min chart above at 254.
MoM you're right, the channels are not in vogue :(
Well , expanding out the 10 min chart, there is a nice down channel- too steep to see on the above 10 min charts:(
Is that 4 slope chages I see? Maybe, but I don't do knives. :)
 
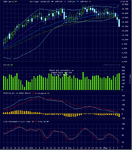
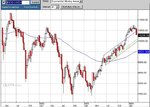
CM, your mid bear flag target of 254 is in the same ballpark as the daily hitting the 100 EMA.

Time will tell as always.
 
Last edited:
Just saw the futs price 10180 flash across the screen………when it tanks, it tanks…..!

(did I buy – yes, but sold pronto for +38…….don’t trust it at all…..)

Looking at the bigger picture, the long standing 600 channel delivered its target, and now we have the biggest break below the 50ma for a year…….supercycle reversal..?!…watching closely…
 

Attachments

  • 11-03-04.gif
    11-03-04.gif
    20.7 KB · Views: 259
TS, so if u take the break of the current channel, the target is around 10,250 - wot a coincidence !

If it does bounce around there, the we'll still be in an uptrend with the current drop simply a correction.

However, I don't reckon its gonna offer much support with current news and sentiment :(
 
Mom - you can buy (or sell!) it now for around 10200 - anyone going for it........!?......... ;)
 
Chaps, although I'm sorely tempted to try and catch a bottom (!) and go long, I think wiser course of action would be to short any rallyies.

Or stay out ...
 
The bottom at 230 price seemed to have es vol divergence.

Maybe CM or someone else can confirm - as I am not totally sure

230 also had S1 pivot point support, not that it means anything when the market is falling so hard.

Spoke too soon I guess as the price is headed back south as I write
 
mind the bounce of the daily 100MA seems to be doing the trick.

Too late for me to realise that and take a long :(
 
Mombasa, what am I missing when I do not understand what you mean by jump in daily 100MA?
Please clarify? Much appreciated, thanks
 
bg - sorry bad typing.

I meant that dow has bounced of the 100 EMA on daily chart
 
Top