Dow Intraday charts 08/Mar - 12/Mar

OES - Just a lucky guess (I guess....:cool: )

don't mention Mr G. - it'll bring out the bears again....... :LOL:

edit:- 20.16 - price 230 - I said the bears would come out (spooky.... :cheesy: :LOL: (fortunately been short for most of the way down))

edit:- 20.58 - covered short at 180 - slightly premature (by about 60points..!!) - this index has sprung a serious leak..... :confused:
 
Last edited:
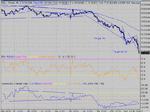
More of the same, another slope change... one more and it'll be vertical ! 3 day's of CCI divergence. Still not looking to catch a knife...
 

Attachments

  • dow 11-03-04 10.gif
    dow 11-03-04 10.gif
    27.2 KB · Views: 354
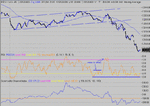
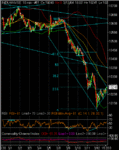
Doesn't look much... until you look at the numbers on the right...200 point drop! Hope you got some. :cheesy:
 

Attachments

  • dow 11-03-04 11.gif
    dow 11-03-04 11.gif
    21 KB · Views: 347
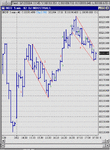
Is that 1 bull flag on the 1min chart? Or is market already rolling over for another leg down?


edit: actually it looks more like an expanding triangle or "trombone", a patter coinciding out of control and emotional markets, with usually a lot of public participation.
 
Both DOW and ES bounced exactly of the fib .618 correction of advance from yesterdays' lows to todays' highs (resp 153.72 and 1108.25)!
Are bulls giving it another shot?
 
Only scalping a few here and there watching the trendline down from 200 with support c 165 as the next clue for direction.

16:45 Looking a bit top heavy at the mo time for profits and tea :D
 
Last edited:
3 waves up and into resistance. Will it complete the 5th after a pullback to 100EMA (or 10180 to shake out a few more bulls)? Asc tri target 285ish I think. If this wave 4 is a bull flag it\s target is c255, more realistic.
 
Last edited:
Interestingly ES is stalling advance at ~ fib 0.618 of decline from yesterdays' high to low. DOW is underperforming as equivalent level is at ~10245.

What kinda pattern has the DOW? I see ND i RSI and CCI. Possibly a small H&S if we turn down below neckline at 10209 (perhgaps I am letting imagination run a bit!!)
 
FRUGI, forth wave as a bull flag?

OES, seems like another H&S forming, not too clever with targets I'm afraid. Break point seems like 200sh
 
Anmol,

Well, perhaps not a bull flag as it's gone on a bit long, but here's some waves anyway!
 

Attachments

  • clipboard.gif
    clipboard.gif
    26.4 KB · Views: 420
Stop sitting at 38% of today's advance and make your mind up whether you're going to break out or down:D

10256 here we come or do we have to go back down to 10163/175 fibs?

SOX, COMP, broker/dealer and banks leading us up. Could turn out to be a bull gorgeous day as China is fond of saying, but them bears may be just sharpening their claws and polishing their bull traps for further assaults later.
 
5th wave now negated...down to 162?

I'll get me coat :D

4th wave was a trickster, pretended to break down, formed a down sloping funnel and then broke out up. They're often messy. But we'll need a lot of energy to break HOD. Revised target now about 245 I think = ES 1120ish.
 
Last edited:
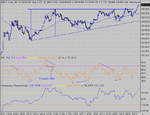
Nice move up, and closing at a resistance point. RSI shows not a lot of room for upside so maybe a pullback will happen... Of course, if it were to turn out to be a Bear flag , we have a target of 10,050...
 

Attachments

  • dow 12-03-04 10.gif
    dow 12-03-04 10.gif
    25.2 KB · Views: 323
The one min chart shows a bull triangle, target 295/300... Closing at HOD is iften followed by a continuation. A day of divergences, so I guess TS had a ball :) Good riddance to the Bears I say.
 

Attachments

  • dow 12-03-04 1.gif
    dow 12-03-04 1.gif
    23.9 KB · Views: 324
Very true that Friday was a good day for tradeable divergences CM, but was not trading/screen watching during market open time.... :cool:

I was able to take a long on the futs at 10112 in the morning and was quickly able to put a stop in at 135, so decided to just leave it running in anticipation of a good bounce as I probably would have closed early if I had been watching.......will let it run for a while in anticipation of a possible 50% retracement of the fall, but will run a trailing stop to lock in some profit if it decides to go for further downside….(have noticed that it’s partial to prompt retests of extreme high/low levels……! :confused: )

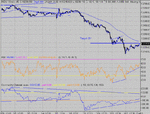
Probably too early to draw trendlines, but here's a shot at it......
 

Attachments

  • 14-03-04.gif
    14-03-04.gif
    21.2 KB · Views: 255
Last edited:
Top