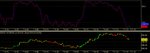
Clown's 2007 outlook is work in progress

The stochastic

Good evening,

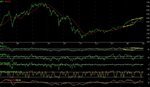
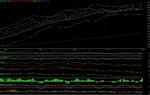
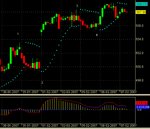
The two studies..... They are hard to read. She uses it with a trend. The spread she plots in a histogram. I really don't know how to create such a chart (balen). I will look in to it a bit further, because she get nice results. Not only with the trend but also with the averages she uses. I think you look for the same.

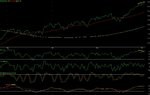
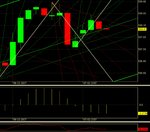
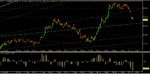
The standard is the one never to use. Default club, remember? Nice to see we uses the same stoch. Same teacher perhaps ;) ? Further more I see a PR in the stoch (AEX). The same is happening on the other side of the ocean (S&P).

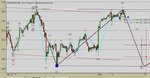
But we use a different KVKD system. Mine didn't broke jet. Not saying it couldn't be broken. Together with both PR's in the stoch. and RSI (508,xx) Monday can be positive. If not, you know my exit now..... 503 will be the first target.
In the intra-day I have a target of 513,30 and the weekly PR is still open..... Probably not in a straight line!

Heb nog twee plaatjes voor de liefhebbers....
 

Attachments

  • Uur grafiek 1.gif
    Uur grafiek 1.gif
    13.3 KB · Views: 213
  • ES mini.gif
    ES mini.gif
    16.3 KB · Views: 239
Last edited:
Rules

Just to follow the rules exactly. After the PR that will reach its target at 512,44 there will be a ND. According to Brown, the event must take place immediately after the end of the signal. After 512,44 the ND must do its work. I know that the targetmathematics are only valid after reversals and not after divergencies, its tantalizing to do otherwise. Start PR 386,52, end PR 420,52, top 478,00 ====512,44
Start ND 478,00, end ND probably 512,44 bottom 420,52====386,08.
Other possibility the most recent ND start 492,96 end 512,44, bottom 473,32====453,84.
It looks like 512,44 will be reached next week, so we'll soon have an answer.
Pacito
 

Attachments

  • AEXWEEK.JPG
    AEXWEEK.JPG
    82.5 KB · Views: 194
Pr Nd Nr Pd

Pacito said:
I know that the targetmathematics are only valid after reversals and not after divergencies, its tantalizing to do otherwise.

Hoi Pacito,

Nice to see. I've seen the same in all time-frames. If this is trough, that means the PR for the S&P (zie plaatje) is valid. First target is 1458,5
We'll see.

Happy trading

Blinker
Remember: "Negative divergence is positive and positive divergence is negative!"
 
Pr???

Dear Blinker,
I don't see a PR in the S&P500. The divergence in the views of Brown and Cardwell doesn't mean that a ND is automaticly a PR (133) It can happen when and if a channel is formed. But I don't see that channel. Not in the weekly nor in the daily graphs. Only in the 15 min graph, but then, its dependend on a spike.

Pacito
 

Attachments

  • SP.JPG
    SP.JPG
    138.5 KB · Views: 182
  • SPweek.JPG
    SPweek.JPG
    107.1 KB · Views: 192
Week 6.

From an Elliott Wave perspective my preferred scenario seriously doubts the best scoring scenario as referenced to the ideal wave pattern (see for specifics the above posts). An other avenue I pursue is the mathematical combination of alternative wave count scenarios and the result shows this week since quite a long time the doubt. Elliott wave uses wave labels which are categorized in different layers or Time Horizons from high (longest time) to low they are Super Cycle, Cycle, Primary, Intermediate, Minor, Minute, Minuette and there are a couple more. If we take a closer look at the AEX the Super Cycle and Cycle are positive and here it is, the Primary Intermediate and Minor levels have all changed from positive into neutral this week. To complete the picture the Minute level remains positive. The neutral effectively means that both positive and negative wave counts have similar scores the ultimate Kan Vriezen Kan Dooien situation.

Let me try to translate what the message is here. The Elliott wave patterns are a combination of price and time relationships that ideally follow specific shape and form. Everyone noticed that the AEX did not seriously move, from a buy and hold perspective, in January so price was not effected that much, yes you got the picture we now have February so Time did change. Sure it’s not the hard signal we are looking for merely an objective confirmation of what we have already seen playing the market. From the Elliott Analysis the next step would be the confirmation with definite negative wave count starting with the wrapping up of the lowest level (Minute). This is what we (Believe and myself) did last week by looking at the wave count starting at 496,62 and this part has not yet been concluded.
One more exercise in the Elliott related scenery I would like to do with you and that’s the time relationship given the found first wave I continue to work with until proven otherwise. The first time hit for a second wave was the January 3rd – 8th range, the second time hit is the February 7th – 12th range so it’s going to be interesting from this angle, to complete the picture the next time hit is early April.

The best scoring wave count starting at 509 the present high presents a WXYc pattern with W on 498,97, X on 508,52 and for wave Y there are at this point in time seven pattern options scoring values closely together. All these patterns have the first two waves on 496,64 and 408,39 respectively and can be divided into two groups the three wave patterns and the five wave patterns. Basically they all target in the ideal pattern the 496,62 region on Monday with three exceptions (one lower and two later) so our trading roadmap for the coming week has its outlines.

The time aspect is something that keeps me puzzling since I seem to be bumping into it in Elliott Analysis, Cycle Analysis and Gann Analysis as said to be playing on important role. Many people who studied Gann refer to Astronomy as being the key differentiator in his work but nobody seems to be able to point out how. My most recent go at a way to capture the astronomy angle into something workable resulted in an indicator that ultimately shows turning points related to different Cycle levels. The January 17th did something for the DJIA and the next dates are February 10th and 11th that have a 50% higher indicator level.

From the trending perspective the short term trend turned back into positive last week so the focus of attention within the KVKD system is on the support area’s where the trading to win signals are to be found providing the trend doesn’t change again of course. The perfect next trading signal to win might be found Monday or Tuesday when/if a Positive Reversal Signal is formed in the support area. As the amplitude and spread of the reversal signals become smaller one must be prepared to take in account that the end of the road is coming closer. The level of that ending will be more clear in the next phase.

Have Fun trading.
 

Attachments

  • aaa.jpg
    aaa.jpg
    219.5 KB · Views: 256
+ 5*c

Dear Pacito,

The PR given in the S&P was shown to you in my ploatje. It's the second one, the hourly S&P.

@Clown

Interesting story! The flat you tell us about is also shown in the RSI. Top in the upper zone and bottoms in the support zone. Thats also KVKD. The two scenarios are: the 2th wave in the weekly stands and we are in the beginning of wave 3, or we get a 50% retrace which is 489 (+ gap closed). Target still 523.82

Eén ding is zeker.... buiten dooit het!

Blinker
 
Winter in Brabant heerlijk.........

One of the things I am currently working on is phasing out the Hermes Jaad software which is totally out of date and the owner does not move an inch out of his old school technical analysis. The only thing I think its worth while looking in to is the dynamical RSI so I did some studying and I now have it implemented in my new infrastructure even better and more flexible. I now can manipulate the adaptive character in such a way that it is more in line with the Range Rules as well.

Also implemented is the derivative oscillator as written in chapter 14 of the book. The thing working for me is just putting that stuff up on-line and work with it for a while to see what it does or perhaps change it a bit to be more in line with my own trading habits. If you recall the early chapters in the book about cycles and the Stochastics well I have implemented a dominant cycle finder according to the Elder definitions because the single frequency trigonometric regression is a bit too static and indirect. So welcome to the non default club.

The middle of the KVKD system that did the trick on Monday and Tuesday and is back in the picture again however there is a difference that you might find if you take a closer look at the derivative oscillator. I have attached my intraday trading roadmap.

Have Fun.

EDIT:
Believe,
Using Elliott wave will frequently result in conflicting scenario’s as you know so you need to integrate other techniques like the Elliott oscillator to qualify the different counts however there are more roads that lead towards Rome. Let’s do a wave count from a totally different perspective (attachment 2), something I have been playing with for a while including the Elliott oscillator and the derivative oscillator. If one takes this angle the wave 5 should considered to be in. The trending angle in the first attachment allows a wave 5 a bit higher so let’s watch this piece even closer from a trending angle with a 507,10 Gann Fan (attachment 3). It’s going to be exciting.
 

Attachments

  • aaa.jpg
    aaa.jpg
    769.4 KB · Views: 267
  • aaa1.jpg
    aaa1.jpg
    674.3 KB · Views: 219
  • aaa.jpg
    aaa.jpg
    407.3 KB · Views: 226
Last edited:
Zwarte Piet

What we currently see happening imho are higher prices due to a lack of buyers. Huh? Yep, the price is moving up, because there are no buyers left anymore. The typical ending fase of a ralley. Not sure wether we've seen the high already but it won't take long anymore. Extreme high futures and an exhaustion gap is what I want to see in yank land, and it looks like we're not far of a blow off scenario. So I doubt Santa Claus is coming to town any time soon now, but hey its not december yet so what do you expect.
 

Attachments

  • a.gif
    a.gif
    10 KB · Views: 200
  • d.GIF
    d.GIF
    9.8 KB · Views: 185
  • c.GIF
    c.GIF
    8.9 KB · Views: 206
  • b.GIF
    b.GIF
    11.5 KB · Views: 188
Last edited:
Clown, you would do me a great favor to post your thumbnails in such a way that I don't need a 50 inch screen to watch the thumbnails.
Thanks
Pacito
 
rules of priority

it appears when trading on f.i. reversals, reversals with oppposite direction may show up.
ref. enclosed example, what are the rules of engagement, I mean which one has in general priority?. Brownie isn't so clear in this respect . For the moment I tend to choose in order of sequence......not necessarily in line with my MT expectations....an intraday catch 22?

PS while typing the PR target has been met.......before the earlier NR
 

Attachments

  • aex070207.gif
    aex070207.gif
    41.1 KB · Views: 232
I'm sorry Quick, but it seems to me that you make a mess of the signals. It's quite allright to take tops and bottoms that aren't the biggest tops and bottoms. But its another thing to just take a small retracement somewhere in a trend to start a line. Your PR starts at a false beginning. If you put it right, there is no PR.
On the other hand, if you start at 14.15 and end at the same point there is a PR.
Pacito
 
Dear Pacito,
truly I do appreciate your answer. nevertheless thusfar I tend to have alternate interpretation of Brown's ideas, regards your remarks a) the false beginning and b) the small retracement as a starting point. Also it may be true that 1 minute chart signals may be out of perspective, on the other hand (fractal) theories claim these things should be applicable on any level of detail. Some of her examples clearly demonstrate quite subtle, non-obvious (easily overlooked) and small signals, f.i. fig.4-9. Further, taking into mind her remarks regards disregarding spikes and key-reversals ( "market failures") and "hidden signals" (f.i. fig 8-1) , it may seem quite valid to disregard the obvious tops and bottoms. When it comes to reverse engineering, I would think every inbetween tick counts. This reverse engineering is the fundament for the easy rule of thumb "calculation" when determining reversal price targets (x-w+y etc.). Anyhow, I have to learn and experience a lot more, before I feel comfortable tarding on these signals. So I do appreciate all your comments. Nevertheless my main question remains: what are the rules of priority when encountering contrary signals?
 
If and when you think you have a signal, then the trend should immediatly change or continue according to the signal. Ideal the target should be met right away. This is not always the case. The target can be missed. I do think a sign that has no immediate follow-up is a false sign. So imho the sign that formed last is the sign to watch. The earlier has proven to be of no value. (see also the discussion in Brown concerning the forming of channels)
Pacito

On second thought I may be missing the point. There can be contradictory signs comparing different timeframes. I know the thinking in fractals. To me the signs appearing in a fractal does belong to that fractal and is not valid at another level. All important is the timeframe you are talking about. There will be no discussion about the fact that the trend since 2003 is up. That doesn't mean there can be no countertrends. But they are a part of the big trend, not the trend itself. This is also, according to me, the case in a graph that shows tics or minutes or hours. You should not mix them. The only way to see them is in the next higher level. Of course you can spot a change in trend earlier in a lower level, but still it needs confirmation in the higher level. This is, as I see it, the cause of a lot of misunderstandings. Not knowing exactly about which timeframe one is speaking, makes the whole conversation worthless.
 
Last edited:
man man ik kon gister middag de site niet meer op

Quick,

There is actually whole lot of information in the Brown book including some that isn’t actually in the book which is also important information. As to reversal signals the book is specifically crystal clear and offers a number of views. First of all it points out that reversal signals should occur on different timeframes to gain importance. Secondly the book offers several suggestions to develop custom made non default club indicators. And thirdly if one is the typical lazy trader who doesn’t want to know one can buy the definitions of a home made indicator by the author.

Let me repeat my previous suggestion to you and use larger timeframes to trade on and use the fast ones to learn and check your trade signals. An other suggestion you will find in the book is to throw away most of what’s on your screen since it is impossible to track it all simultaneously it will help you to prioritize your aids. If you take a look at chapter 14 you will find an additional aid which I have put on your 1 minute graph from yesterday, I would say not too bad. If you implement the dominant cycle into the Stochastics for the given timeframe and minute chart you get the attached chart.

It’s important that you do the things you do right but it’s even far more important to do the right things. By the way I did not check any reversal signals in the charts.
 

Attachments

  • aaa.jpg
    aaa.jpg
    378.8 KB · Views: 215
  • aaa1.jpg
    aaa1.jpg
    491.5 KB · Views: 185
PR or no PR, that's the guestion

Dear members T2W,

Yesterday Quick asked about PR's. Pacito answered something like "it must be a pivot". I disagree with that. Conny says something about "Hidden one's" I really think she finds them with a spreadsheet. She also showed us a figure.
Knowing that, imho the daily chart is giving us a new PR. Fig. 1

That's one way to get targets. Fibo has a different Approach. They are everywhere, different fibo's in different time-frames.
Also shown in the first figure is an Elliott counting. I don't know if the experts agree, please react. Maybe we can start up a discussion?
(1 and 2) is a weekly count, 1 and 2 is a daily count, the smaller ones are intra-day. If the counting isn't correct, are we still in a flat period?

The second chart is a hourly fti. Yesterday I had a PR of 510,10 Around that point I had 3 fibo's within 0,15 point. So it had to be an important target. Between 503,10 and 503,60 I found four fibo's. So with the Elliott counting in the intra-day, the fanns and the fibo zone I think that is the first target for tomorrow. After that wave B is up.... 506 has also 4 fibo's and is the 38,2% retracement. Or could it be that the 503 is the correction and we move up to the PR of 512,85?
Now the daily has a PR of 511,03 Guess what, the (upper red) 1,618 target is 512,20 Isn't that nice?

Success and hope to hear from you.....
 

Attachments

  • uur 8-2.gif
    uur 8-2.gif
    26.8 KB · Views: 217
  • dag 8-2.gif
    dag 8-2.gif
    25.5 KB · Views: 195
Last edited:
I'm sorry, but if you read things I didn't write, you have a problem with interpretation. I try to choose my words very carefully just to avoid misunderstandings. I described a bottom, no more no less. If your interpretation of a bottom is every retracement, that's fine with me, but not my opinion. The reasoning is that of a politician; repeat the question but just off line, and then oppose to something that was never there. I like to keep things simple so that everybody, including myself, can understand it. It seems to me the only way to learn and eventually to get a feeling for it.
Pacito
 
tijd om wat lucht in de brownies terug te pompen..

Dear allt2w,
regards Blinker's PR in the daily: acc.to Brown this PR should be negated, because the RSI trend line drawn is violating the RSI. There is a valid one 512,31 in the hourly chart (enclosed) and f.i. in the 15min chart (514,4). Ref earlier posts I have found that trading the 1min reversal signals work out reasonably well between 09.00 and 15:30. after 15.30u it's a mess due US.
thx Clown for yr advise: your stochastics looks like de stoch momentum index, though I have not found yet settings to replicate the picture. The Inverse Fisher RSI gives clear signals and does compare to your stoch signals depending settings. Did you test your dominant cycle in this one too? Curious about your findings. See figure 2. For the rest I am looking for indicators like CCI ? Ultimate oscillator etc. to find additional signals for confirmation or negation of the RSI signals. Once in the TA toolkit, I will dig into Brown's derivative further.
Trade well
 

Attachments

  • aex080207.gif
    aex080207.gif
    36.7 KB · Views: 175
  • aex070207_01.gif
    aex070207_01.gif
    39.7 KB · Views: 187
Pacito said:
.............. its another thing to just take a small retracement somewhere in a trend to start a line. Your PR starts at a false beginning. If you put it right, there is no PR.
Pacito

Dear Pacito,

I'm sorry if I hurt your feelings. That's not my intension. A misunderstanding is quickly made, even in Dutch. It's my intension to contribute in this thread, not to go to war.....
I referred to the above post. My interpretation was that you meant something like pivots (bottoms). I think what Quick is doing is quit alright. Only the target is a bit less higher. Still a PR.

@Quick,

It's an other example of hidden reversals. I remember her writing something like "look for the same closing-price in history, they tell you more" This is one interpretation of "telling you more"....

What about Elliott? Was the I-II-III of yesterday an A-B-C? "Should be" you say. An correction is always A-B-C.
For that matter, wave two was simpel so wave 4 is different. Expiration at 507 and target 509,60?


With regards,

Blinker
 

Attachments

  • uur 9-2.gif
    uur 9-2.gif
    19.9 KB · Views: 210
Top