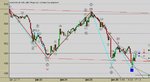
December 22 RSI 55,1184 AEX 490,77.
January 10 RSI 50,3434 AEX 492,49.
January 3 RSI 65,5273 AEX 501,35 PR
Goal 492,49-490,77+501,35= 503,07 met on january 15.
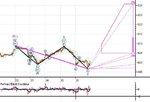
January 10 RSI 50,3434 AEX 492,49
January 19 RSI 65,6563 AEX 507,12
January 29 RSI must fall below 50,3434 and AEX must be higher than 492,49, then a PR will be formed, keeping in mind that the AEX should not be lower the 30st.
Pacito
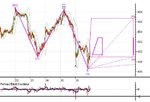
January 10 RSI 50,3434 AEX 492,49.
January 3 RSI 65,5273 AEX 501,35 PR
Goal 492,49-490,77+501,35= 503,07 met on january 15.
January 10 RSI 50,3434 AEX 492,49
January 19 RSI 65,6563 AEX 507,12
January 29 RSI must fall below 50,3434 and AEX must be higher than 492,49, then a PR will be formed, keeping in mind that the AEX should not be lower the 30st.
Pacito
Last edited: