The Dutch Clown
Established member
- Messages
- 592
- Likes
- 11
Last week we watched this months interview on Finance Television with someone who translates the weekly updates made by R. Merriman. For a couple of years (it might very well be four years now –joke-) now this (too) blond woman is telling us that we should expect a market correction based on the 4 years cycle of more than 20% of the top. One thing I have to add, the company is called ”Market Timing” well what can I say, one should leave out the word Timing since it stinks from here to Tokyo. Last week I presented a Cycle scoop so you now know how to use Cycles like the 4 year cycle you hear so many analysts talking about. Realize that there is a curtain flexibility in the time aspect (more details in the week 33 weekly). So let us this week look at astronomy a bit closer.
One of the things that is very straight forward and easy to find is to look at the position of planets in the Houses. Let me cut a corner here by just referring to research that shows links between the number of planets in specific Houses, the economy cycles and stock-market cycles. The ones to look for are Virgo and Leo which correspond with low and high respectively when they appear in numbers. So is we cut an other corner and look for periods – once again simply eyeballing the AEX daily chart from January 1985 until last Friday- where they both appear in numbers and close to one another we should be in business. The first relevant hit is august 1987 with four Lions and five Virgins (sorry I could not help myself). Early September 1989 we have four Lions and four Virgins and the list is impressive but please bear in mind that it is not a thing that will pinpoint to the day or hour.
So we are now up to speed and ready for what’s coming when I tell you that we will have Five Lions end of August (in fact this Monday and Tuesday) and four Virgins early September. If we take a look at the present stock-market situation we can not overlook the fact that the market is “topping” rather than “bottoming”. To complete this angle it should be mentioned that in August 2007 we will find five Lions and five Virgins very close together. So according to a Clown’s methodology we are coming closer to a trading roadmap defining the outlines combining Cycle Analysis and Astronomy integrating this into the Elliott Wave Analysis.
Maybe I should add an other piece of relevance here in order to find your way through all this. Cycles come in all sorts and they are ordered hierarchy by the length of the cycle from long to short and the longer cycles are divided in sub-cycles. Now is the challenge that the sub-cycles vary in length to form (a number of sub-cycles together) a cycle of a longer period. And this last cycle is again one of the sub-cycles of a cycle with an even longer period and this continues for as long as we have relevant data. If you take a moment or so to realize the above basics you now understand why there are so many cyclists so totally differently forecasting stock-market cycles and when read one firstly understand what sort of cycles are involved anyway. If we now focus on what Astronomy really is and forget about the rest we must notice that planets travel in space according to a route which lasts a defined time period. And those can also be called cycles so here we are to take it just one step further for now. When planets travel in circles one can divide those circles in parts and define the different parts. And if a number of planets are in the same part/section at a certain point in time it is like cycles intersect, if you are still with me so far you now understand the relevance. There is a bit more to add but maybe an other time.
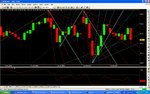
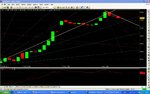
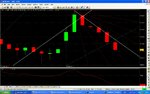
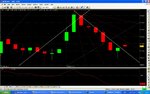
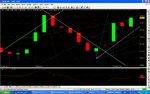
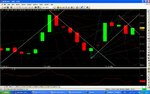
One of the most powerful tools Mr. W.D. Gann provided is the forecasting methodology by squaring price and time, without going into the details let’s leave it by stating that price and time targets can be calculated in the future. If we review the swing from 217,80 in the AEX we are entering the time cluster where a full 360 grade cycle is valid. Due to elapsed time and price, the definitions of Mr. Gann’s findings and the tolerances found applicable from numerous previous real-life similar situations it can not be pin-pointed to a single day or hour. The last comparable situation was May this year and I don’t have to explain what has happened there, well the one thing to be said right now is we will hitting a few points in time and price once more.
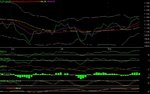
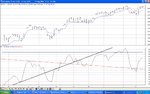
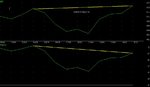
What we do have to improve accuracy is to use the Technical Analysis with a bunch of indicators and what we might call “the new way of working with old indicators”. The AEX RSI in the EOD chart is entering the upper side of the Range Rules leaving us with upside potential but not enough to travel towards the target of the at this forum presented Positive Reversal target, scoring in the meantime the target of a so called “hidden” reversal target. For the people familiar with the “dynamic” RSI the overbought value is 66,52 with a RSI value of 66,04 last Friday. For cross checking I use the DJIA and if we review the DJIA EOD chart we notice that (again in the dynamic RSI) the DJIA has become overbought last Friday. The DJIA scored the price target of a “hidden” reversal as well as the AEX, the target of the (still open not “hidden”) reversal signal however is extremely close so it’s going to be a close call whether or not it’s going to be met in this swing.
Although I have asked you to bar with me maybe a bit too much just a bit more since it is relevant as you might agree. Individual planets form cycles as you have seen, taking it a level beyond try to picture that planets to each other form again cycles and that’s what we call aspects. When the planets that run cycles of years and years like Saturn and Neptune form an aspect you have an event that does not happen that often. So if I tell you that Saturn and Neptune form an aspect end of August 2006 and twice in 2007 (February and May) lets have a look what happened at the stock-market in the previous similar situations. And there we are, it is so rare that it did not happen in 30 years of AEX data so I have to run it against the DJIA data file starting 1915 – see now why I keep such a huge data file-. Due to the character of this event – it happened only twice in the given period I review the trading set-up (explanation see earlier Weekly) over a period of a year so we end up with:
Long.
Rew OK 02-09-2005 SV 26-03-2007 100% (6om0 grootste win 74,38%)
Risk OK 31-08-2005 SV 16-07-2006 100% (6om0 grootste win 51,35%)
Short
Rew OV 27-03-2007 SK 31-08-2007 50% (3om3 grootste win 43,95% verlies 6,59%)
Risk is in the already in the past.
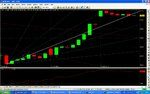
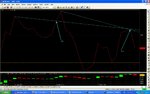
As usual I have given you the raw facts. It’s going to be exciting to see things evolving over the next couple of day’s and the intraday chart will help to find the trades to win again.
S6.
Disclaimer: this weekly is for educational purposes only.
One of the things that is very straight forward and easy to find is to look at the position of planets in the Houses. Let me cut a corner here by just referring to research that shows links between the number of planets in specific Houses, the economy cycles and stock-market cycles. The ones to look for are Virgo and Leo which correspond with low and high respectively when they appear in numbers. So is we cut an other corner and look for periods – once again simply eyeballing the AEX daily chart from January 1985 until last Friday- where they both appear in numbers and close to one another we should be in business. The first relevant hit is august 1987 with four Lions and five Virgins (sorry I could not help myself). Early September 1989 we have four Lions and four Virgins and the list is impressive but please bear in mind that it is not a thing that will pinpoint to the day or hour.
So we are now up to speed and ready for what’s coming when I tell you that we will have Five Lions end of August (in fact this Monday and Tuesday) and four Virgins early September. If we take a look at the present stock-market situation we can not overlook the fact that the market is “topping” rather than “bottoming”. To complete this angle it should be mentioned that in August 2007 we will find five Lions and five Virgins very close together. So according to a Clown’s methodology we are coming closer to a trading roadmap defining the outlines combining Cycle Analysis and Astronomy integrating this into the Elliott Wave Analysis.
Maybe I should add an other piece of relevance here in order to find your way through all this. Cycles come in all sorts and they are ordered hierarchy by the length of the cycle from long to short and the longer cycles are divided in sub-cycles. Now is the challenge that the sub-cycles vary in length to form (a number of sub-cycles together) a cycle of a longer period. And this last cycle is again one of the sub-cycles of a cycle with an even longer period and this continues for as long as we have relevant data. If you take a moment or so to realize the above basics you now understand why there are so many cyclists so totally differently forecasting stock-market cycles and when read one firstly understand what sort of cycles are involved anyway. If we now focus on what Astronomy really is and forget about the rest we must notice that planets travel in space according to a route which lasts a defined time period. And those can also be called cycles so here we are to take it just one step further for now. When planets travel in circles one can divide those circles in parts and define the different parts. And if a number of planets are in the same part/section at a certain point in time it is like cycles intersect, if you are still with me so far you now understand the relevance. There is a bit more to add but maybe an other time.
One of the most powerful tools Mr. W.D. Gann provided is the forecasting methodology by squaring price and time, without going into the details let’s leave it by stating that price and time targets can be calculated in the future. If we review the swing from 217,80 in the AEX we are entering the time cluster where a full 360 grade cycle is valid. Due to elapsed time and price, the definitions of Mr. Gann’s findings and the tolerances found applicable from numerous previous real-life similar situations it can not be pin-pointed to a single day or hour. The last comparable situation was May this year and I don’t have to explain what has happened there, well the one thing to be said right now is we will hitting a few points in time and price once more.
What we do have to improve accuracy is to use the Technical Analysis with a bunch of indicators and what we might call “the new way of working with old indicators”. The AEX RSI in the EOD chart is entering the upper side of the Range Rules leaving us with upside potential but not enough to travel towards the target of the at this forum presented Positive Reversal target, scoring in the meantime the target of a so called “hidden” reversal target. For the people familiar with the “dynamic” RSI the overbought value is 66,52 with a RSI value of 66,04 last Friday. For cross checking I use the DJIA and if we review the DJIA EOD chart we notice that (again in the dynamic RSI) the DJIA has become overbought last Friday. The DJIA scored the price target of a “hidden” reversal as well as the AEX, the target of the (still open not “hidden”) reversal signal however is extremely close so it’s going to be a close call whether or not it’s going to be met in this swing.
Although I have asked you to bar with me maybe a bit too much just a bit more since it is relevant as you might agree. Individual planets form cycles as you have seen, taking it a level beyond try to picture that planets to each other form again cycles and that’s what we call aspects. When the planets that run cycles of years and years like Saturn and Neptune form an aspect you have an event that does not happen that often. So if I tell you that Saturn and Neptune form an aspect end of August 2006 and twice in 2007 (February and May) lets have a look what happened at the stock-market in the previous similar situations. And there we are, it is so rare that it did not happen in 30 years of AEX data so I have to run it against the DJIA data file starting 1915 – see now why I keep such a huge data file-. Due to the character of this event – it happened only twice in the given period I review the trading set-up (explanation see earlier Weekly) over a period of a year so we end up with:
Long.
Rew OK 02-09-2005 SV 26-03-2007 100% (6om0 grootste win 74,38%)
Risk OK 31-08-2005 SV 16-07-2006 100% (6om0 grootste win 51,35%)
Short
Rew OV 27-03-2007 SK 31-08-2007 50% (3om3 grootste win 43,95% verlies 6,59%)
Risk is in the already in the past.
As usual I have given you the raw facts. It’s going to be exciting to see things evolving over the next couple of day’s and the intraday chart will help to find the trades to win again.
S6.
Disclaimer: this weekly is for educational purposes only.