Clown's Weekly 30.

The Dutch Clown

Established member
Messages
592
Likes
11
A short one this week.

So every once in a while one faces contrary analysis from different techniques and this is a period where it is quite a challenge to get to the bottom of a structured analysis.

In the EOD picture we have found some time ago a Positive Reversal with a price target above 500 we are on track and short/medium AEX targets below 300 seem to be out of the picture. It might very well come as a bit of a scare that the Elliott Wave Analysis explicitly keeps a 400-375 target range open (mind you it’s not the preferred scenario mere a possibility that has to be taken into account).

The intraday movements gave us a Positive Reversal with a target that missed about one index point. The route was accompanied by disproportional movement in the oscillator which caused alert signals and the movement was even more disproportional which let to a Negative Reversal signal. I must admit that I am on uncovered territory here because the literature does not handle complex examples. Although the Range Rules must be added to the picture to clear some of the dark clouds it’s not enough to the high standards I use. This is the part where I consider myself fortunate to be able to combining several different techniques in order to be able to escape.

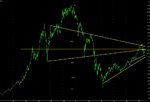
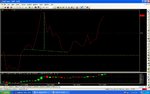
Let’s take a look at the monthly graph first(first attachment), the struggle with the 2 x 1 line in June and July, just keep it in mind that when the AEX moves down a bit further so you will know where we are and what to expect next. The EOD graph shows (second attachment)a bit more exciting as the AEX closed last Friday just under the 409 trend line upwards and above the trend line downwards from 478.

The intraday graph we will watch through the day.

The cross check DJIA from 11670 has wave three (3:)downwards starting at 11256 with price targets 10538 10320 first time indication is July 25th and second is August 9th. Within this wave an other wave three has been formed starting at 11038 (3:3) with price targets 10608 10476 and time indications 24th and 25th of July.

S6.
 

Attachments

  • AEXGannmaand.jpg
    AEXGannmaand.jpg
    329.1 KB · Views: 370
  • AEXdag.jpg
    AEXdag.jpg
    370.8 KB · Views: 363
maandag 24 juli 2006.

Let's review the intraday graph.

The previous mentioned PR target is still in the market and although the move upwards has shown a disproportional movement in the oscillator and even formed a NR signal the oscillator was picked up in the RR and it looks right now that the AEX is going to meet the PR price target.... the best thing that can happen is, that this is done with negative divergence so it will be a confirmation for the NR....

To be able to trace the movements I have added a trend line from 435,09 and we will see when, how and where....

Fun or what?!

PS het lijkt wel een vag..na monoloog...

II.

We have a winner the price target calculated 17-7 is in.....

III.
It's going to be a close call and better wait a bit before getting the shorts in place... the NR signal is under attack......
 

Attachments

  • AEXuur.jpg
    AEXuur.jpg
    483.8 KB · Views: 331
  • AEXuur.jpg
    AEXuur.jpg
    468.5 KB · Views: 339
Last edited:
Clown no direct comment on AEX but ......looks like heading into a wall very soon. This momentum is outrageous ....I'm sitting on my hands until it runs out of steam. In the past I've been rewarded by Philips and Asml - now I'm scared about buying them and they're not high enough for me to short them.

H
 
dinsdag 25 juli 2006.

The Negative Reversal Signal was blown out of the water yesterday. The RSI was OB and is today cooling down towards the (435,09) trendline in the graph. Note that this trendline is meeting the 1 x 2 line (422,71 green).
 

Attachments

  • AEXuur.jpg
    AEXuur.jpg
    463.4 KB · Views: 377
Dear Clown,
didn't post much. Still trying to understand the book of Brown. Indeed, chapter 9 is very interesting. Pity that she stops where it should become real good. Takes quite some time to fully comprehend what she is trying to say. I don't like to pick up some pieces, I want to understand the lot. About lines from the past, see a ten year linedrawing. Next year should be very interesting.
To your health,
Pacito
 

Attachments

  • lijnaex.JPG
    lijnaex.JPG
    79.5 KB · Views: 357
Dear Pacito,

It's an introduction to Gann so see it as that and an invite to study more...

See Chapter 8 look at an intraday hourly graph.. compare today 16.00u with yesterday 10.00u do the math of chapter 8 and you will know...

Cheers....
 
Well Pacito,

What can I say ... are you in space... or still doing your math.... at this point we are 0.72 index point away..... ready to do more maths's??

Like in a Dutch saying ..... the money is lying in the street... you just have to pick it up...

Bulls eye...
 
Clown,
doing math? I'm building a 100 story building using Elliot, Fibonacci, Gann, RSI. I feel like just starting throwing concrete at the 25st floor. Don't forget the dust I have to pick up in between. Brown is sometimes very helpfull but sometimes frustrating. Especially when she states a circle divided in sixes where I can see it's divided in eights. Nevertheless I'm progressing. Yesterday, sitting on the terrace enjoying the liquid inside of an old bottle, I realized I'm a lousy architect. Planning a 110 story skyscraper and noticing that when I proceed the way I did so far, I'll end up having a pyramid of 89 levels. At the moment I'm putting lines through squares and I get an uncanny feeling that sometime next year ( ca january 30), there will be a dramatic change. For the moment I will continue trying to get everything on the same top at the same date. Meanwhile I'll be happy to read your contributions.
Cheers
Pacito
 
Pacito,

The Gann chapter is an introduction if you do not fully understand yet work with the tools that help you make a proffit.... work on new things, trade with the help of proven technology that works for you.... again take a closer look at chapter 8 since the signals pay out... I scored over 6 index points with that trade already and the target still has to come... maybe the attached graph will help you.... see chapter 8...
 

Attachments

  • AEXuur.jpg
    AEXuur.jpg
    271.8 KB · Views: 292
Clown,
don't be afraid. I did understand you yesterday. So everything is still under control. I teared chapter 8 apart. I did all sorts of math in my wall Street files. I must say that it's a feeling if you can conquer the whole world. Yet it can sometimes go wrong. I'm very interested in the signs when things can go wrong, described as reshifting of the cycle. Still I want to do my own math just to see if its possible to foresee a big change, and be there at the moment it starts.
Thanks
Pacito
 
Dear Pacito,

You will have to read the last bit of the chapter in which the author indicates the reliability of the signals..... again it is not the whole picture.... forget about the big swings.... focus on the reliability.... better 6,65 index points in two day's with a high reliability than huge future with poor reliability.... just through a number of FTI's in and make Euri 200 x 6,65 (minus some change in cost) x number of FTI........take the money and run... in the pocket... or at the bank is better in my view... even better is spending it....

The signals happen frequently.... I scored two in the last two weeks and well what can I say... the EOD graph allows a bit higher index but the intraday target has been met... so I closed winnings.... the intraday RSI is quite OB so there is bound to happen something soon...
 
Dear Clown,
I agree. I closed my options just before closing. This could be the end of a zig-zag. Comparing to the Dax we seem overenthousiastic. We are close to a bottom of July 01, a bottom of March 06, fibonacci 68, the upper bollinger line and there seems to be a bearish divergence with the RSI coming up.
I did my homework, I even put the Cardwell EMA 45 and MA 9 into the RSI. Pattern compatible with the chart on page 262 (fig 10-19).
Stay on gard,
Pacito
 
dear Pacito,

You must have an other book or just want to verify mine... page 262 in my book is blank... chapter 10 is on elliott wave...

Now the intraday movement of the oscillator is disproportional and we all know what that means by now... is remains to be seen how disproportional it will become and calcutate new reversal targets if and when...
 
Dear Clown,
As it happens, in my book page 262 is also a blank.
Sorry, it was a little dark. Page 202(fig 10-19)

Pacito
 
dear Pacito,

No problemo.... your reference to to fig was clear enough...

In the mean time the disproprotional movement in the oscillator has formed an other Reversal signal (again) the index is well below the 2 x 1 line(upwards one) and follows the 2 x 1 line downwards from the 452,51 pivot..... looking for more clue's now to enter a trade....

Nice and easy... just an other swimming pool...
 
Well what can I say... so let me just show you where my entry point was.... the target well, read the book and do the math... it's going to be an other 6 points trade again....

Have a nice weekend...
 

Attachments

  • AEXuur.jpg
    AEXuur.jpg
    349.1 KB · Views: 273
Hi clown. Its monday. A sixpoint trade down today? If the EOD is going to be lower, the RSI (day) remains in the bearrange. Could be a reversal day according to my Gann math.
Pacito
 
Pacito,

I skip a week (had some hardware/software problems over the weekend and am fed up with the Bill G ****) so relax a bit this is my kind of whether... .... did scalp though this morning 3,5 point down it was too good to let it go..... disproportional movement in the oscillator.... but the pivot today was at negative divergence... also the amplitude is getting a bit large.....

Gann from pivot high today under trend line..... there is a crossing later (not today) between two Gann pivot lines from downstairs.... around the 450 ( <)....and also meeting the today's pivot trend line...

The DJIA has a preferred scenario with a third wave down from the pivot high and again a third wave 3:3 within this wave.... might be inclusive the former wave but the time indication last Friday might hit......

Have fun and remember we trade to win here.....
 
nice and easy and when we are going to the finish of this song...

It's going my way again.... the relief in the stressed indicator value is blowing off perfectly and at this pace a nice signal is being formed.... if looking at the EOD graph we have some time left.... so easy does it....

It's the right time to smoke a very nice sigar.....

by the way note that the pivot was formed at negative divergence.....
 
Multi level support lines

This is something to alert.......

EDIT:
We need to include the EOD picture so here it is....
 

Attachments

  • AEXuur.jpg
    AEXuur.jpg
    359.8 KB · Views: 235
  • AEXdag.jpg
    AEXdag.jpg
    360.5 KB · Views: 252
Last edited:
Top