Clown's Weekly 30.

What's happening in Yank'sland?!

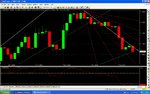
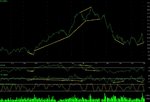
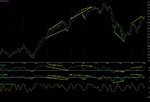
Well what can I say ; it's a bit of a struggle like in the AEX today, the DJIA is at a crossing right now.. it dropped an upwards line (green to green) ... and if we scale a downwards trendline (red) you can see for yourself where we are with the Dow...
notice that the RSI has dropped and altough the amplitude has become a bit large there is a reversal signal present..... and since we know that the AEX is the leading index I would say the Dow wil turn up around here..... at least we can see a pause now ...
 

Attachments

  • DJIAhourly.jpg
    DJIAhourly.jpg
    344.5 KB · Views: 283
Here we are

Well what to say.. let me just add the target of the reversal...11391.9 no Sir not today and yes Sir it might very well be more...
 
Beste Clown,

Ik ben aan het zoeken geweest naar de boekenlijst die U hebt opgegeven. Ik kon hem niet meer vinden. Zou U misschien zo vriendelijk willen zijn, te verwijzen naar waar hij staat of hem te mailen of nogmaals te plaatsen?

Bij voorbaat dank.

Annette
 
Technical Analysis for the Trading professional by Constance Brown. isbn 0-07-012062-5
Elliot Wave Principle by Frost and Prechter isbn 0-932750-75-3
Goed voor enkele weken studie.
Pacito
 
Nogmaals de boeken lijst dan

Boeken Lijst:

In de onderstaande boeken treft u de basis aan waar Clown zijn informatie gevonden heeft al dient u zich terdege te realiseren dat er niet zoiets is als hapklare brokken. Niemand heeft het volledige overzicht – als dat überhaupt al mogelijk is - en net als u zult ervaren, ben ook ik op toch wel veel gesloten deuren gestuit, al zijn een paar van die deuren met wat centjes wel open te krijgen.

TA introductie en begrip vorming:
Omdat u ergens moet beginnen, er zijn uiteraard ook ander boeken maar u vraagt het mij en hier ben ik zelf mee begonnen.
Martin Pring’s Introduction to Technical Analysis
Martin J. Pring Technician’s guide to Day & Swing Trading.

TA voor gevorderden:
Naast nieuwe inzichten in het gebruik van TA indicatoren gebruikt C. Brown ook Elliott Wave en Gann doch haar “geheim” wil ze geheel in de stijl van W.D. Gann niet prijsgeven.
C. Brown Technical Analysis for the Trading Professional.

Elliott Wave:
Ter introductie volstaat het standaard werk van Prechter en als u iets verder bent dan kunt u of de gehele set boeken van Prechter bestellen of diverse andere werken waarvan het werk van Neely best aardig is.

Frost and Prechter Elliott Wave Principle
Glenn Neely Mastering Elliott Wave

Gann:
Op de site van de nazaten van W.D. Gann treft u verschillende boeken en aanbiedingen aan het is aan u en uw portemonnee dat te bestellen wat u past. Zelf heb ik de aanbieding Complete set of Gann Books. U dient zich overigens te realiseren dat dit geen compleet overzicht is ondanks de suggestie. W.D. Gann heeft heel veel cursussen gegeven en daarin aantekeningen gemaakt en de evolutie van zijn gedachtegoed is daarin terug te vinden. Helaas zult u nergens een compleet overzicht vinden, mocht u zo iets toch aantreffen dan houd ik mij ten zeerste aanbevolen. Verder is er een boekenlijst welke Gann zelf aanbeveelt om te lezen, dit is een beetje over the top maar goed u heeft wel het complete plaatje.


WAARSCHUWING:
Al diverse malen heb ik ,melding gemaakt van het feit dat er heel veel lieden onder de noemer Gann u iets proberen te verkopen. Sterker nog er is een groepje bloedzuigers dat zelfs meent dat te hebben gevonden wat Gann zelf nooit gepubluiceerd heeft. Let wel voor een kleine $ 300,= heeft u de meeste boeken van Gann in huis en kunt u lezen wat hij heeft geschreven..... en dan kunt u zelf beoordelen of datgene wat aangeboden wordt de moeite waard is.
 
to all posters on this thread (TB excluded):

Could you please stick to one language? It makes it incredibly irritating if you start a conversation in English and then switch halfway through, as those people who can't read Dutch are then lost.

Thankyou.
 
Oeps... I am sorry .... the Question was in Dutch and I had the answer in Dutch on file from a previous answer to the same question..... so we will continue in Dutch next week ..... by the way all the mentioned books are in English....
 
What's happening in Yank's Land.....

The DJIA has managed to get to lose the grip of the trend from pivot-down and is following the trend from pivot-up... but be aware that this is happening at the higher Ranges and the Rules will apply as they always do... that's why we call them Rules.... No Sir I am not Mr Wiseguy... please notice the green line from the previous pivot-up that might be a bridge too far or will serve as a potential pivot-down..... and so we are looking at the disproportional movement in the oscillator once more...... and while I am typing the 1 x 2 line (blue like ) is starting to show Resistance signs...

just the thoughts of a Clown.... and mind you a Dutch one....
 

Attachments

  • DJIAhourly.jpg
    DJIAhourly.jpg
    393.2 KB · Views: 258
Clown,

Are you referring to the negative divergence on the hourly chart? On the 15 minute chart things look a little bit different. There was some divergence yesterday on that chart and the correction it triggered may already be in the past. Just a thought. If the RSI on the 15 minute chart moves beyond 70 I think we may be on our way to the target you calculated. But I have my doubts. Time will tell.

JvdLow
 
Dear jvdlow,

Just for you a zoomed out a bit on the graph..... put it on your screen... in the right bottom side a pop-up is shown... no not so fast with your cursor... slowly easy does it ....yes that's it now klick it......... now look at the picture and notice the disproportional movement on the oscillator... think Elliott Wave... and voila....... remember what the Elliott Oscillator tells you in a wave 5.... well what can I say.... you have already seen the negative divergence....

It's time for my after dinner sigar... a very fine Dutch Olifant type Fidelio.... that's what I call a gentleman' s smoke.... you see I addapt to the forum visitors rapidly.
 

Attachments

  • DJIAhourly.jpg
    DJIAhourly.jpg
    437.1 KB · Views: 267
Next week. AEX is bouncing on the line from the top in March through the bottom in April.
There is a Reversed HSH pattern that should test the neckline at ca 441,5.
A slight divergence pattern in the RSI. 8/2 top 455,30 RSI 62,5480, 8/4 top 455,80 RSI 61,2210 .
According to Brown y-(w-x)= 450,65-(455,80-455,30)=450,15. That will be just above 23,6% Fib.
So what will next week be. First a target of 450,15. Then maybe at 38,2% a target of 444,8 and at 50% 441,5. So 50% is also the neckline.
What does Gann say Clown.
Pacito
 

Attachments

  • aex48.JPG
    aex48.JPG
    133.9 KB · Views: 265
"A slight divergence pattern in the RSI. 8/2 top 455,30 RSI 62,5480, 8/4 top 455,80 RSI 61,2210 . According to Brown y-(w-x)= 450,65-(455,80-455,30)=450,15. That will be just above 23,6% Fib. So what will next week be. First a target of 450,15."

Hang on Pacito, you're describing a case of possible negative divergence (lower RSI, higher price). But you're applying a formula which is used for a Negative Reversal: a higher RSI at a lower price. Or am I missing something?
 
jvdlow said:
"A slight divergence pattern in the RSI. 8/2 top 455,30 RSI 62,5480, 8/4 top 455,80 RSI 61,2210 . According to Brown y-(w-x)= 450,65-(455,80-455,30)=450,15. That will be just above 23,6% Fib. So what will next week be. First a target of 450,15."

Hang on Pacito, you're describing a case of possible negative divergence (lower RSI, higher price). But you're applying a formula which is used for a Negative Reversal: a higher RSI at a lower price. Or am I missing something?

Sorry, you are right. Can evolve to a bearish divergence, not a negative reversal. I know I'm using the formula for a negative reversal. Indeed there is no mention in chapter 8 of using it this way, but I don't see why not.

Pacito
 
Pacito said:
Sorry, you are right. Can evolve to a bearish divergence, not a negative reversal. I know I'm using the formula for a negative reversal. Indeed there is no mention in chapter 8 of using it this way, but I don't see why not.

Pacito
Well, if you did use it that way, you'd have a target of 450.65+0.50 = 451.15. But I doubt you should be using it that way. Maybe the only way to find out is by backtesting it. Maybe on bullish divergences too. I haven't arrived at that chapter yet.
 
Dear Friends

Dear friends. A question is it general. The indexes examining by means of the number of rising shares to the number of decreasing shares give that to the feeling testing the ring line no heavy work would be. Grant does not look in its whole strong, but a couple shares keeps the matter high. These yielded the heavier boys with figures. It that net this way fare as the others stands 441,5 this way on the bord


Bernardo
 
Cassandra said:
Dear friends. A question is it general. The indexes examining by means of the number of rising shares to the number of decreasing shares give that to the feeling testing the ring line no heavy work would be. Grant does not look in its whole strong, but a couple shares keeps the matter high. These yielded the heavier boys with figures. It that net this way fare as the others stands 441,5 this way on the bord


Bernardo
Dear Cassandra,
I'm puzzled. I'm used to the cryptic way Clown expresses himself, but this is quite new to me.
Please explain.

To all,
Next question. I think I found an indicator that, used next to the RSI, gives just a little bit more information about bottoms. It gives more bullish divergences and positive reversals than the RSI. I only tested it for bottoms, not for higs. I give you two examples attached. What do you think about it.
 

Attachments

  • abnema5.JPG
    abnema5.JPG
    117.3 KB · Views: 243
  • aexema5.JPG
    aexema5.JPG
    109.2 KB · Views: 254
Last edited:
dear Pacito,

It's like C Brown explains... only after testing... the proof of the pudding is in the eating...

Cassandra,
That's a bit too much "tosti" for me just like the munnie floow.... advans en dieclein....
Mind you a cross check might be an indication fi if RDSA PHI ING AAB all look + well you got the picture....

Time for a cheese sandwich....
 
Clown,

Looks like a PR on the 15-minute chart to me. Price target 459.3. It's a bit early to call it. I'd like to see the RSI break through 40 and maybe test it again. The fact that we didn't get oversold on the 15-minute chart seems to suggest that this is merely a pullback we're seeing.

What are your thoughts?

JvdLow
 
Top