Clown's 2007 outlook is work in progress

pssonice said:
what about today , tomorrow, yest, or the day before yest.

if the situation was clear at those times, I ve to ask u why u didnt tell us that the situation was clear.

By the way, what does this mean ?

It is the battle between the old and the new... :cheesy:
 
Clown

As I said the keys are laying in the US ... The technical question was if the Dow and the S& P would start a wave 5 as the Nasdaq was starting to move upwards...
If the 502 on the AEX is falling then wave 4 is not started yet... :cheesy:

Rgds

Gogo
 
Last edited:
Hi all,

There might be an inverse SHS pattern in the AEX soon. If GJN prediction is correct and we will hit 512 soon, then the neckline is broken and the AEX could go to 530-540 in march. Is that possible in EW terms?
The RSi has made a W-pattern at the 50-line very similar to the situation medio september 2006 and the the AEX gained about 30 points till end of october 2006.

regards
 
he ho he ho de dwergen hebben lol

Gogo,

The DJIA is no mystery what so ever and for quite some time it has a Positive Reversal Signal in the chart as I mentioned in this and the previous thread. Also I have explained that the key influencer is the eur\dol which is demonstrating a 123 move and the million dollar question is whether or not the 2 has been completed, a peep at the chart. And you know of course that the 3 is being supported by PR signals as the 1 was anyway even the trending methodology can be applied.

It’s easy to do a quick check on your Elliott wave count by just looking at an Elliott Oscillator. Well what can I say?! And elaborating in this area you will find that the NR signal is still valid and the target has not been met. The Short Term Trending as taught by GJN is still down.

During the absence of GJN his flock is left in the dark again and it strikes me that nobody is understanding the Technical Analysis he uses. From his view which is based on Long and Medium Term trending the trend is up and within this the former resistance will have to prove to serve as support which until today has been the actual situation. And the inverse statement is true so that is the thing to watch closely in the ST charts and guess what happens when they cross. In order to continue the LT and MLT trend the ST trend will have to change and until this has not happened, yep you have got that right. Fun!

Rentenier,

The best fit Elliott scenario – meaning best scoring referenced to Mr. Elliott his findings – has a wave 1 409,65-498,45 a wave 2 498,45-470,54 and a wave 3 from 470,54 up and this pattern is in compliance with your scenario. In the above post however I have expressed my doubt about the wave 2 being completed yet and those arguments are still valid. The problem I have with patterns like SHS is that they are too subjective and I did not yet find a way to objectively analyze a chart looking for those type of patterns.
Attached you find the AEX EOD chart which is of course a snapshot. A number of the most relevant RSI lines are included so it should be pretty clear what is happening. I must admit that from a Technical Analysis point of view it’s an extremely interesting picture and one needs in fact some background in reading the charts.

From a Traders point of view this is where the interesting entry point occur.

Have a nice weekend.
 

Attachments

  • aaa.jpg
    aaa.jpg
    637.2 KB · Views: 343
Jean qui pleure et Jean qui rit ...

Clown

Interesting your mentioning the EUR/USD factor... Of course there is a correlation between the AEX and the USD. But this is not that great for other European indices. I must confess that I'm not that good in this field. It is also bizarre that there is not much focus on this subject, although GJ mentioned he was interested in that question... In his analysis he doesn't specify it clearly, but fore sure he looks at the conditions on the Asian and American markets before starting his daily...
You mentioned the Elliott Oscillator...Bloody hell, you give some new homework ! So far I remember you were suspicious about this tool...so I didn't focus on it! Nevertheless I start reading right away...:cheesy:

Business keeps me very busy last days and I will be back not before Tuesday I thing... Meanwhile , have a nice week-end !

Gogo

P.S. Technically news, the Bollinger is closing, the index has potential to 503.48 max and support on 494.88 ...
 
Last edited:
Elliot vraagje

Dear TA'ers,

I've found a counting in the hourly chart. What do you think? I think we get an other boost for the 5th wave up. It's coming soon.

There are a few PR's coming up in the intra-day charts. They tell me above the 504. I wonder.....

Some make it happen and some see it happen.....

Success, T2win...
 

Attachments

  • AEX uur.gif
    AEX uur.gif
    33.8 KB · Views: 312
Thanks Clown,

In the meantime the AEX has made some progress and the ami's too, so it looks like up. The NR line was almost hit at 3rd of januari, I don't know if it is valid anymore. Besides the amplitude is quite large, also not in its favour. But we will see what will happen in the near future.

Your lines in the RSI are a bit different from how I draw them. I draw only lines through "points of divergence" (somewhere in the book there is a small remark about that). You can see the result in the attachment upper part of myIndicator (the lower part is some experimental stuff). The next crossing of those lines is at the 24th of januari. There might be a change of trend at that time.

prettig weekend
 

Attachments

  • aex20070112.gif
    aex20070112.gif
    28.9 KB · Views: 291
Topje op?

This is my contribution of what I think will happen the first half year.....

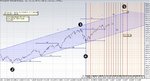
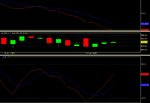
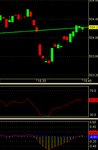
I've adjusted some lines in my chart. If my interpretation of the theory is right the first goal on Monday is 505,45 in the fti. Chart 1
Wave 2 has two closes at the 50% and a spike at the 61,8 retracement. From bottom 2 till the high at 3 (v) I measure 200%. In two extended waves till the 1,618% retracement. 2,618 gives an target at 505,45. Today we closed exactly at the 1,618 target of an other fibo. Look in the blue circle.

Chart two
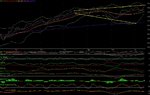
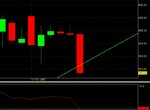
Tja, and after that? We need to look at the bigger picture (day). My best guess is that this is the second five wave up from the low of 470. There is one problem I can't solve that is the bottom at last Wednesday. I count a little 5 wave. This can also be a wave A. Now the wave B and because if this is true, we get a wave C below A. The NR clown speaks of could then appear. Bottom 470 is A, The B wave is created as I wright this. A C wave will bottom at the
I don't have a PR in this time-frame. For that I look to other time frames. Chart four.
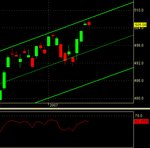
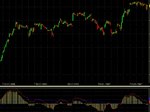
Chart three
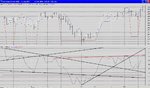
If You count the complete 5 wave in December. This is a 400% fibo target. I have posted this in an other thread. The hourly has a target of 505,45. This one (240 min) has a target of 505,99 Sometimes the first target is at a 127,2% from top till bottom. Even so this is a 200% fibo of the fibo's I found in this chart.
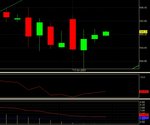
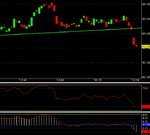
Chart four
The weekly chart still has a PR of 514,24 We are now at the (red) 1,618 fibo target. The 200% is at 521,27
The yellow fibo is a complete bigger wave. The bottom of June is exactly at the 61,8 retracement. Targets are further away.....

Chart five
This is the monthly. 61,% retracement is 528,xx In time this will be a short one. In points the fit is ok. After that? What is Your own guess?


Resume
First target (Monday) is 505,45 After that a PR at 514.24 Two fibo's at 521,27 and 528,xx After the 5 in the month (march or april) we will go down.

These are mine targets and wave counts based upon what I've read and now (think) I know. If You all add the above mentioned together You'll get an other picture of the start of this year than Clown started in this thread. If anybody else sees other things I don't see in the charts, please let me know.

Now You know where I put my money........

There are people who make it happen and there are people who see it happen. The difference is the P.....

Groetjes,

Blinker
 

Attachments

  • AEX 240.gif
    AEX 240.gif
    22.6 KB · Views: 243
  • AEX dag.gif
    AEX dag.gif
    23.5 KB · Views: 232
  • AEX uur 2.gif
    AEX uur 2.gif
    33.6 KB · Views: 229
  • AEX week.gif
    AEX week.gif
    29.2 KB · Views: 219
  • AEX maand.gif
    AEX maand.gif
    36.3 KB · Views: 275
Nice charts,
I have a somewhat longer bull market.
Golf 1 took 11 months to complete, golf 3 took 21 months. Golf 5 will probably take also 11 months.
50% for golf 5 would be 5+ and we passed that in november. 61,8% would bring us to the third week of december, so I go for the 100%. That would bring us to the second half of may.
Since 2004 the time between two consecutive tops has been 206 days. The last one on the 10th of november would bring us to the first of june.
At the pace we are moving forward and up we would reach 445 at the start of june. 445 happens to be the 61,8% extension of the 415-495 range. That doesn't mean we can't get a dip in februari ( starting januari 31) but its my view on the longer term.
Pacito
 

Attachments

  • 1.jpg
    1.jpg
    384.1 KB · Views: 250
Last edited:
I took some time to read the analysis in the threads Clown posted since becoming a member of T2W. I must say reading the threads, and looking at what the AEX did, made me sometimes shiver. Its coming close to perfection. I know, results from the past and so on......... But it gave me hope that we are heading in the right direction.
Pacito
 
Short term expectations. We are still moving to the upper band of the triangle. The upper band runs at 507-508. I expect a downturn when we will reach it. The downturn could bring us to the lower band running at 460. The longer it takes, the more aggresive the downturn will be. I still think this will happen 31st of january, but january 17 or 18 are second best. The ND at the AEX, the S&P500 and the DOW (daily) will take its toll. Keep in mind: this is short term. It isn't a contradiction with my posting for the longer term.
Pacito
 

Attachments

  • aextriangle.JPG
    aextriangle.JPG
    151.3 KB · Views: 274
Last edited:
En nu?

I also had read all threads of Clown. Because of him I purchased a book and began to read. The reason: he is often right and I was wondering "how is it possible?"

I studied that book and put in 3 to 4 hours work (after-hours) each day to create and optimise the different charts. All that studying begins to pay off. I begin to feel the rhythm of the charts now.
Today I closed my longs (previous post). Waiting for a small decline. First target - in my opinion - is 501,35

Success.........
 
Last edited:
There's almost nothing wrong with the analysis. That's not the problem. The timing is crucial. However, trading is a different game as Clown said several times. At the moment I'm trying to set up a trading system that is independent as far as the trend is concerned. When everyone is looking at charts there must be some other way to earn money without spending so much time on the computer just for not missing the trendchange. I will be going on analyzing, because it gives me a better knowledge of what is happening. On the other hand I think that too much information can trouble my view.
Pacito
 
tsja als het nou gewoon goed werkt, dan toch KVKD maar!

Things are not always what they seem to be and same applies to the stock market, this is making anticipating on future movements extremely complex and on the other side fascinating. In order to get some grip on the stock market movements in my view a top down approach should be used and a large scale could be used as a backbone to add details to it.
From a Technical Analysis point of view two price levels (as in range!) are more than relevant 518 and 530 and it should be pretty clear where they come from. So given these two price levels the multi million dollar question is: straight up to both the first or well you have got the picture.

The 2007 projection which is based on past stock market performance indicated a turn early January and a drop until mid February before meeting the two relevant price levels. This was backed up by the Reversal Signal situation. Presently the Negative Reversal Signal which holds the AEX still is active and due to the nature of the signal has created some upward potential for the AEX. Short Term the move up created potential to form new PR signals that can be validated as well. The Clowndicator showed activity for the Long Term Cycles end 2006 and the first day’s of 2007 the next LTC activity is November/December so later this year. The Medium Term Cycles shows activity on January 17th and the next activity is mid February even slightly higher.

The KVKD system intended to do exactly that Pacito to spend less time at the computers looking at charts and spend more quality time living. I have attached the present EOD KVKD system which is used to work in concert with the Clown’s trading Almanac. It has cost me a bundle to get some analysis form in synchronization with trading rule number 1 and I still have times I just find it hard to believe what such a simple system delivers. Like I have said here in post 1 at times I have found that I had too much information and the Dutch saying with the Forrest and the trees did apply. My solution is to find a way to better qualify the information and limit the number of used indicators or better said the way how you use them.

Trade to Win that’s fun.
 

Attachments

  • aaa.jpg
    aaa.jpg
    438.8 KB · Views: 318
nice system ??

Dear Dutch Clown,

Yes, still here and reading and studying what is written. Nice outlook. Seems the last days some "work in progress"

Funny to see my alias everywhere these days. Easy system, only be there when it is exiting at a potential turning point. Today at 09.00 was the time to be there. At the Eurostoxx50 which I like best.

Regards and suc6

KvKd

Anyhow, you are missed in the "koffiekamer" ;)
 
Last edited:
he ho he ho het is een KVKD

Without a shadow of a doubt you watch the current AEX movement like a hawk and reference it towards the RSI movement in order to see things happening like has been described on page 58 of the book. A series of Positive Reversals has being formed and taken out one by one except the last one and now the PR potential has run out so this should be the one. This Positive Reversal signal is in sync with the one that has been present in the week chart for some time. From a traders point of view you would now like to see some Positive Divergence that would create a W shaped form in the RSI.

January the 17th has arrived and you probably can imagine that I am curious to see what is going to happen over the next couple of days since the Clowndicator demonstrates a peak in planet activity on different time cycles.

The hourly KVKD system is attached including both RSI and Elliott Oscillator. To complete the picture a slow and fast Stochastics.


EDIT:
Wakker worden ik ruik koffie!! ploatje3

EDIT2: bij ploatje4
Speciaal voor u meneer Blinker de Elliott Oscillator onder de koers... enne hij telt ech nie lekker....

EDIT3: bij ploatje 5
ja ja ja ...aaaaaaahh

EDIT4: bij ploatje 6
toe dan toe het dan schoen wijveke... ge weth toch dak uw geire zie.... toe het dan.....
tsja het is buige of barste
 

Attachments

  • aaa.jpg
    aaa.jpg
    202.2 KB · Views: 261
  • aaa1.jpg
    aaa1.jpg
    198.4 KB · Views: 253
  • aaa.jpg
    aaa.jpg
    117.1 KB · Views: 251
  • aaa.jpg
    aaa.jpg
    322.1 KB · Views: 254
  • aaa.jpg
    aaa.jpg
    205.4 KB · Views: 256
  • aaa.jpg
    aaa.jpg
    435.3 KB · Views: 276
Last edited:
Zie ik daar een zonnetje door de bewolking komen?

Well, what should I say. Not to much.

The resent line is just below the somewhat older one. If this one holds, we could get up again. Otherwise the KvKd-system gives the exit also.

Remember... trade2win
 

Attachments

  • Elliott telling.gif
    Elliott telling.gif
    10.9 KB · Views: 267
The Elliott oscillator

Hai Clown,

Well, the Elliott oscillator..... I really don't know what it is and how it's working.

I think the tool must help when we are in doubt? Is it a lagging one? Can it predict?
Because You and I don't react but anticipate. With that You need to see in to the future.

I just measure and keep counting. Doing all that till I feel the rhythm of the Financial Markets.
Maybe I'm wrong, but than it gives me an exit as well and I'll keep counting the opposite way. If it's keeps the chimney smoking, all's well. ;)

Here's my prediction of tomorrow.....

Have fun and T2W

Blinker

By the way, I'm long since 16:30 hr
 

Attachments

  • Elliott telling 1.gif
    Elliott telling 1.gif
    7.5 KB · Views: 277
Last edited:
Een stukje Elliott Oscillator theorie.

Blinker,

The Elliott Oscillator has nothing to do with lagging or reading it just is an aid to help you count waves. The most important single concept about the Elliott Oscillator is that the highest/lowest point of the Oscillator is connected to the bullish/bearish Wave 3 of the swing which implies that it is in fact higher than the first wave which consequently should be lower. Related concepts are that Wave 4 crosses the zero line in the opposite direction of the trend. Wave 5 often makes a new high or low price for the swing but always diverges from the Oscillator. If the suspected Wave 5 makes a new extreme price simultaneously with a new Oscillator extreme then it is not a Wave 5.

An impulse wave in a textbook version looks like the attachment which is what you are looking for in the actual charts you are looking at. And accordingly you might find that a corrective wave has a corresponding Elliott Oscillator wave pattern count. Last and not least the Elliott Oscillator shows divergences the RSI will not expose due to the nature of the thing. If I recall correctly that’s precisely the Brown argument for something like the Composite toy.
 

Attachments

  • aaa.jpg
    aaa.jpg
    316.5 KB · Views: 242
Clown,

Thank You for the explanation.
If I am correct, the oscillator is at the end so we will now get a corrective wave?
Tomorrow will tell us.

Tomorrow I have an appointment outside. Be back at 4:30 in the pm.

Good luck,

Blinker
 
Top