You are using an out of date browser. It may not display this or other websites correctly.
You should upgrade or use an alternative browser.
You should upgrade or use an alternative browser.
Clown's 2007 outlook is work in progress
- Thread starter The Dutch Clown
- Start date
- Watchers 26
The Dutch Clown
Established member
- Messages
- 592
- Likes
- 11
man man effe Apeldoorn belle, die zijn dus nie thuis?!
Blinker,
Just took a flash light and beamed it at my shed, well I better say the place where the shed was and now a pile of stones and wood. The corral has also been blown away for a part. So I am not having fun and the storm is not over!
Blinker,
Just took a flash light and beamed it at my shed, well I better say the place where the shed was and now a pile of stones and wood. The corral has also been blown away for a part. So I am not having fun and the storm is not over!
Van over hier wil ik je een hart onder de riem steken
Wow, that's big. No one hurt? I wish You all the best.
Tomorrow will be better, with a little bit of sun. Hang on just a few hours!
Good luck.......
The Dutch Clown said:Blinker,
Just took a flash light and beamed it at my shed, well I better say the place where the shed was and now a pile of stones and wood. The corral has also been blown away for a part. So I am not having fun and the storm is not over!
Wow, that's big. No one hurt? I wish You all the best.
Tomorrow will be better, with a little bit of sun. Hang on just a few hours!
Good luck.......
The Dutch Clown
Established member
- Messages
- 592
- Likes
- 11
Een Clown moet altijd blijven lachen
Thanks,
It's not over yet but I see it as a new beginning of something else..... garden house,..... whirlpool.... sauna?..... a few trades this year et voila
DJIA formed a PR and is testing the exit right now.
Better take a few Whiskey's now... cheers
EDIT:
PS if the PR brakes the next one can not be validated properly like in the AEX yesterday... and guess what the AEX closed outside the hourly KVKD system see previous posts.
he ho he ho
Last edited:
Proost
That's the right additude! See it as a chance. 😉
Remember... "drink met mate"
He ho he ho, I gave it 'cadeau'. Just as I predicted. I closed my longs today at 508,30. Your right about the KVKD-system. But there is a resent one which is still valid. That is also my exit. (Yes, I'm long on the KVKD, 505,20 since 16:30)
Success en proost!
The Dutch Clown said:Thanks,
It's not over yet but I see it as a new beginning of something else..... garden house,..... whirlpool.... sauna?..... a few trades this year et voila
DJIA formed a PR and is testing the exit right now.
Better take a few Whiskey's now... cheers
EDIT:
PS if the PR brakes the next one can not be validated properly like in the AEX yesterday... and guess what the AEX closed outside the hourly KVKD system see previous posts.
he ho he ho
That's the right additude! See it as a chance. 😉
Remember... "drink met mate"
He ho he ho, I gave it 'cadeau'. Just as I predicted. I closed my longs today at 508,30. Your right about the KVKD-system. But there is a resent one which is still valid. That is also my exit. (Yes, I'm long on the KVKD, 505,20 since 16:30)
Success en proost!
Dear Mr. Clown
It's been a while I posted something on this board. It's very interesting to wite down your thoughts about possible future directions of the several indexes, it is even more interesting to read it. Reading your post on IEX fired up my curiosity concerning Gann, EW and other techniques in technical analysis.
I read your outlook for the coming 12 months, I 'm very impressed, not that I did not expect an ill-based article.
I also read that you had problems filtering the real turning points from the false onces using a range rule. I am far from being an expert but I maybe found something that could help you in your quest.
Maybe you already heard about a dutch man Jan Schotsman. He is well aquainted by the techniques used by Gann, Elliot, Bradley, Murray, C. Brown and many others.
Maybe you already knew this, in that case you can disregard this post.
He wrote on a financial chat (The Bosdinges one) that the RSI can sometimes play tricks on us and generate a dummy signal.
http://www.bullnochbear.com/phpBB2/viewtopic.php?t=99
In the above link, he shows a misleading signal generated by the RSI(14), another indicator(stochastic) in addtion to the RSI(14) on te other hand shows the correct information.
http://www.jstas.com/Dow/dow_jones.htm
This article gives some insight into de cycles generated on the DOW
Dominique
The Dutch Clown
Established member
- Messages
- 592
- Likes
- 11
En iedereen zich maar afvragen wat er na 512 komt.......
Dear 2138,
A couple of years ago I used to regularly read Jan Schotman’s contributions but since he is charging money even to cover his costs I stopped doing so. The initiative to join a number of people and have them comment the stock market is simpatico although the commercial wave counter is the very same who wanted us to believe that our society would end with an AEX forecast value in the 70 (yes he really did use the seventy’s ). It might be no secret whatsoever that I encourage to read the relevant literature yourself in order to discover the nuances in theory personally rather than blindly follow someone’s (including mine!) interpretation. In general I feel Jan Schotsman is taking too much an Analysis angle as apposed to a Trader one and I get the impression that he enthusiastically starts a new route but halfway trough stops and changes to yet an other route. Personally I trade for a living and do some Analysis to form a Vision to trade by, if it helps to realize the Trades to Win I keep working on it if not I move on.
W.D. Gann has written a number of books that still can be bought but the more interesting typical Gann things are written in letters and courses which were lost over the years. Every once in a while somebody claims to have found unique Gann material and tries to make some money. The Gann Cycle for instance has many different versions and according to the Gann tradition there is room for interpretation however a number of similar conclusions do seem to pop up every once in a while. Some of them I used to compile the 2007 outlook and as you can see the turning points are there but the level of movement is not (yet) in sync. In general I feel the larger scale one is using the more tolerance one should take in account which is exactly what we currently observe.
The RSI trick’s you are mentioning I cannot discover other than the familiar Reversal Signals introduced to me by GJN who named Brown as his source. And once again I have to refer to the above posts related on the present relevant Reversal Signals still active in the charts. The Negative Reversal Signal was formed mid December last year and is active ever since even today’s new multi year high in the AEX does not change that. In getting my 2007 projection done the two Reversal Signals played a role in the first part of it and I judged them to act in sequence in line with the reengineering outcomes. Second scenario, the “think out of the box” one, seems to be rolling out which changes the 2007 projection slightly even more in sync with the Clowndicator signal. The differentiator in my book should be the way the Signals are being validated and this one of my ongoing projects the last couple of months. If you have read the Brown book “the other indicator” should look a bit familiar to you.
Did you by the way notice the evolution in the GJN column from December 2005 when the Negative Divergence ruled (3xx before the end of the year became 478,44 April 2006) into the recent ones in which the Trend rules over Negative Divergence? Does your bell ring?!
For once and for all please do bare in mind that any Long position to enter should carry an extremely rigid, preferably trailing stop-loss. Trading versus Analysis; the trader is in it for the money he makes trading and the Analyst needs to be frequently right for his monthly paycheck with all due Respect GJN gets a monthly paycheck.
Have Fun.
With this sideways trend it's just waiting. I'll stay with my view I posted before with the expanding wedge for the short term. About trading, I use the volatility. I just buy calls and puts at the money at the end of the day, and I sell the next day the first one that gives a profit. Most of the times the other will give a profit during the same day. If not, I'l keep them untill the next day. I still buy again calls and puts at the money at the end of the day, and so on. Seldom it has been that simple. I only use the fact that a swing during the day is at least 3 points, during a week at least 5 points, and during a month at least 20 points. Most of the times it's more and consequently better. Don't be too greedy. Just sell when the profit is there.
Pacito
Pacito
Last edited:
The Dutch Clown
Established member
- Messages
- 592
- Likes
- 11
A room with a view.....
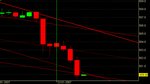
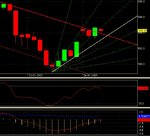
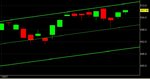
It is turning into a somewhat boring story since the AEX is caught in between the two Reversal Signals (one Negative and one Positive see the above posts for the details) for a lengthy period. A new Positive Reversal Signal which was formed yesterday validated properly and has a number of interesting trading aspects. Last year I would have opened Longs in the auction yesterday, this year I trade with a bit more distance the more robust movements of the year. And mind you entering a Long trade in this phase has to be done with some extra care so confirmation is what we are looking for.
Just notice that the newly formed PR has been blown out of the water and the reversal potential has gone so a new PR can not be properly validated. Yes it has to be said it was an extremely close call but a fact is a fact and definitions are made to follow not to ignore from a trading perspective that’s the distinct difference between profit and loss. The DJIA moved seriously yesterday and entered the first phase of a trend change on the Short Term timeframe.
This will not rule out a movement upwards it’s just the question what or better how we should qualify that movement. The AEX has qualified it as a not properly validated Reversal without the first phase of the trend change yet whereas the DJIA already completed this first phase. In a perfect world I would like to see the AEX show me the first phase, move up within to defined boundaries and there I will find my entry.
EDIT1:
Yes Sir I know the world is not perfect and the stock market is no exception to that rule. It’s just that sometimes it just almost looks perfect so I stressed my KVKD system capabilities sort of to the limit and compiled the above mentioned boundaries.
EDIT2:
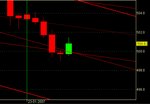
What can I say just look at your own charts and see how beautiful the AEX does its trick today. You are well advised to keep your book open and look at page 58 since a comfortable reversal potential has been created that just needs a Negative Reversal Signal to complete. To complete the picture, the AEX has successfully added phase one of the Short Term trend change + to -. I pulled down the chart a bit so you can get some idea for the downside playing field and no Sir I am not blind to any possible positive changes in this scenario. It is only facts that are considered not the whishes, hopes, believes, expectations, prayers and all the other less objective things people tend to utilize when trading.
EDIT3:
Let’s for the fun of it wrap up today with the close included. Nothing to exciting it ticked like clockwork, the genuine excitement is yet to come. The thing to watch is the Technical Analysis ground rules according to the New School and your first indication will come out of Yank’s Land preferably this evening so we will not be left in the dark for an extra day or so.
Cheers.
It is turning into a somewhat boring story since the AEX is caught in between the two Reversal Signals (one Negative and one Positive see the above posts for the details) for a lengthy period. A new Positive Reversal Signal which was formed yesterday validated properly and has a number of interesting trading aspects. Last year I would have opened Longs in the auction yesterday, this year I trade with a bit more distance the more robust movements of the year. And mind you entering a Long trade in this phase has to be done with some extra care so confirmation is what we are looking for.
Just notice that the newly formed PR has been blown out of the water and the reversal potential has gone so a new PR can not be properly validated. Yes it has to be said it was an extremely close call but a fact is a fact and definitions are made to follow not to ignore from a trading perspective that’s the distinct difference between profit and loss. The DJIA moved seriously yesterday and entered the first phase of a trend change on the Short Term timeframe.
This will not rule out a movement upwards it’s just the question what or better how we should qualify that movement. The AEX has qualified it as a not properly validated Reversal without the first phase of the trend change yet whereas the DJIA already completed this first phase. In a perfect world I would like to see the AEX show me the first phase, move up within to defined boundaries and there I will find my entry.
EDIT1:
Yes Sir I know the world is not perfect and the stock market is no exception to that rule. It’s just that sometimes it just almost looks perfect so I stressed my KVKD system capabilities sort of to the limit and compiled the above mentioned boundaries.
EDIT2:
What can I say just look at your own charts and see how beautiful the AEX does its trick today. You are well advised to keep your book open and look at page 58 since a comfortable reversal potential has been created that just needs a Negative Reversal Signal to complete. To complete the picture, the AEX has successfully added phase one of the Short Term trend change + to -. I pulled down the chart a bit so you can get some idea for the downside playing field and no Sir I am not blind to any possible positive changes in this scenario. It is only facts that are considered not the whishes, hopes, believes, expectations, prayers and all the other less objective things people tend to utilize when trading.
EDIT3:
Let’s for the fun of it wrap up today with the close included. Nothing to exciting it ticked like clockwork, the genuine excitement is yet to come. The thing to watch is the Technical Analysis ground rules according to the New School and your first indication will come out of Yank’s Land preferably this evening so we will not be left in the dark for an extra day or so.
Cheers.
Attachments
Last edited:
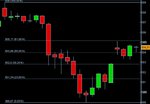
Hi all,
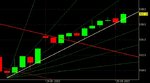
It looks like decision time tomorrow. My momentum indicators all point downward and 23rd maybe a turning point (see my last post about crossing lines in the RSI). The top could be set at 509.00, so I closed all my longs yesterday, even the MT opened at 420 (GJN made a remark that 512 could be the top for for some time).
regards
Attachments
So Clown, you have had your share of dogs excrements at the IEX so far. Happy? History repeats itself but with different names, hihaaa. I didn't post because I didn't change my view. I'm still seeing the expanding triangle doing its job. Main dipsaccording to me, april and september. Top in between in june.
I will post a thumbnail to work with, but it takes some extra work. For the moment, the triangle.
Keep up the good work.
Pacito
I will post a thumbnail to work with, but it takes some extra work. For the moment, the triangle.
Keep up the good work.
Pacito
Attachments
The Dutch Clown
Established member
- Messages
- 592
- Likes
- 11
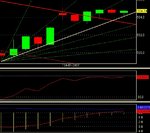
Elliot Oscillator
Lets give it a shot here then since a basic ta discussion seems to be impossible on the other forum. Red line pushing the blue line upwards (elliot oscillator). We've just been sent back by the upper resistance line of the short term channel which points downwards. If we do not break this resistance line (404.5) and impulsively head upwards I expect a downturn below 500 shortly.
Edit1: another ploatje
Indeed dear Clown, it seems like we are facing a new scenario. Apparently we've seen the low already and are heading back up. I must admit I am confused by the index's behavior the last few weeks, but I am still convinced this is the last move up before we'll be confronted with a serious correction of appr. 40 index points due next month.
Edit2: a closer look at REO
If I give the REO a closer look I wonder wether we will reach the suggested target as proposed in the 2nd ploatje. The red line should be turning up soon as for now it is pointing down en will push the bleu line further down making it impossible for the index to reach the suggested target. Perhaps a double top is all there is for now....
Attachments
Last edited:
The Dutch Clown
Established member
- Messages
- 592
- Likes
- 11
ach ja breek me de bek nie open
Believe,
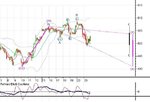
Here you have a combination of different techniques including the Elliott Oscillator. The RSI will have to put a point above that white dotted line.... the EO you know the drill... the rest well what can I say..... Fun it is.
EDIT1:
Just one more piece .... be aware that corrective waves have more retracement levels between 61,8 and 100.
EDIT2:
The picture is becoming a bit less positive as we move along in time. The RSI will be difficult to score a point above the white line, time is running out. The Elliott Oscillator is pretty close to the zero...... mind you 61,8% wow....
The RSI would have scored a nice NR but hence we still have the one in the EOD chart. I will setlle for a confirmation of the short term trend change for now.
Watch the NR scored yesterday in the DJIA for extra checks.
EDIT3
oeps just checked some charts and noticed a PR in the EOD chart with target 509,xx..... so be patient as we might be having a slightly different scenario. The complete the picture the AEX just scored an RSI point above the white line and therefore a NR. The exit is extremely tight so we will know soon enough how and what.
Believe,
Here you have a combination of different techniques including the Elliott Oscillator. The RSI will have to put a point above that white dotted line.... the EO you know the drill... the rest well what can I say..... Fun it is.
EDIT1:
Just one more piece .... be aware that corrective waves have more retracement levels between 61,8 and 100.
EDIT2:
The picture is becoming a bit less positive as we move along in time. The RSI will be difficult to score a point above the white line, time is running out. The Elliott Oscillator is pretty close to the zero...... mind you 61,8% wow....
The RSI would have scored a nice NR but hence we still have the one in the EOD chart. I will setlle for a confirmation of the short term trend change for now.
Watch the NR scored yesterday in the DJIA for extra checks.
EDIT3
oeps just checked some charts and noticed a PR in the EOD chart with target 509,xx..... so be patient as we might be having a slightly different scenario. The complete the picture the AEX just scored an RSI point above the white line and therefore a NR. The exit is extremely tight so we will know soon enough how and what.
Attachments
Last edited:
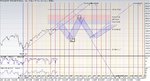
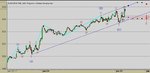
Long term working chart 2007
2007 as I see it today. Taken into account PR's and ND's from the past,squared for price and time. Also sequence of tops and bottoms. And a little rearrangement I made myself. The light blue channels are the outcome of my mathematical twists of mind. Lets see how far I will be from the truth.
Pacito
Attachments
The Dutch Clown
Established member
- Messages
- 592
- Likes
- 11
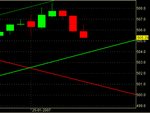
De feiten spreken voor zich.....
Rentenier,
First of all one has to understand where 512 is coming from and the answer has to be found totally out of the box I can tell you from a direct source. Secondly the excitement around 512 has got nothing to do with the stock market but more with GJN’s personal mood as he has written recently so I feel free to point that out as well.
Rather than picking a number on both price and time I prefer to work with ranges and that’s how I compiled the 2007 projection together with some already existing signals that work out in the first part say presently and the weeks to come. This implicates that the next potential turn already has been identified in cold hard objective signaling. Some years ago I first met GJN when he presented to a group of software users and out of this presentation the phrase: “ Voortschrijdende Inzichten” was generated. He asked the assembled users how they saw the stock market evolve over the next year or so. Than took the most extreme values and told us that what ever the actual route would become he would not sit out a complete route with opposite trading positions. Over the years I have changed this insight into using opposing scenario’s and use specific techniques that provide hard objective signaling leaving no interpretation mistakes. This changes the way you look at the stock market since you use an out of the box approach.
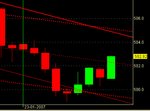
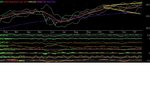
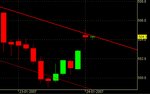
If you look back a number of posts you will see the same KVKD daily (attachment 1) system I just updated it with the recent AEX data, a picture tells one more than a thousand words. The only thing I have to say for myself is that I lost some systems yesterday morning when starting them up. The Gann Fan put in on the intraday (attachment 2) chart and the move out of the intraday KVKD system should have prevented you from entering shorts simply because they both tell you not to. So the Positive Reversal Signal in the daily chart is currently the valid one and it has a target of 409,xx. The intraday NR has hit its exit so that’s gone. The exciting question is how will the Short Term Trend look when the daily PR is done and last but not least the NR signal in the EOD chart from mid December.
Believe,
Welcome here and maybe you will add the Elliott waves so we might have a bit more emphasis on Elliott again. To get things started I have put the AEX from the recent “low” 498,97 on-line and attached a screen print (attachment 3) with the best scoring scenario. Mind you I use the original Elliott patterns and not the add-ons Bob Junior compiled and I presume are being used in the software you use. In the past I played with both and found differences in the analysis outcome so I picked the original thing.
Pacito,
Good work your compilation and given your earlier thoughts in the above posts I have a fairly good idea where you are coming from. Indeed the fun part is to see how the actual thing looks like there are no guarantees what so ever however you have a plan rather that the main lot that is shooting in the dark.
Remember Trade to WIN.
EDIT1: attachment 4.
Due to some time I had to spend with a representative of the insurance company related to the storm damage I was out for a couple of hours. And yes the cliché is true those guy’s are cowboys or secondhand car salesmen of the worst kind. Just thinking about it makes me furious so I better look at the stock market to relax.
A new intraday KVKD system has been constructed and see if we will get a confirmed trading signal this time.
Rentenier,
First of all one has to understand where 512 is coming from and the answer has to be found totally out of the box I can tell you from a direct source. Secondly the excitement around 512 has got nothing to do with the stock market but more with GJN’s personal mood as he has written recently so I feel free to point that out as well.
Rather than picking a number on both price and time I prefer to work with ranges and that’s how I compiled the 2007 projection together with some already existing signals that work out in the first part say presently and the weeks to come. This implicates that the next potential turn already has been identified in cold hard objective signaling. Some years ago I first met GJN when he presented to a group of software users and out of this presentation the phrase: “ Voortschrijdende Inzichten” was generated. He asked the assembled users how they saw the stock market evolve over the next year or so. Than took the most extreme values and told us that what ever the actual route would become he would not sit out a complete route with opposite trading positions. Over the years I have changed this insight into using opposing scenario’s and use specific techniques that provide hard objective signaling leaving no interpretation mistakes. This changes the way you look at the stock market since you use an out of the box approach.
If you look back a number of posts you will see the same KVKD daily (attachment 1) system I just updated it with the recent AEX data, a picture tells one more than a thousand words. The only thing I have to say for myself is that I lost some systems yesterday morning when starting them up. The Gann Fan put in on the intraday (attachment 2) chart and the move out of the intraday KVKD system should have prevented you from entering shorts simply because they both tell you not to. So the Positive Reversal Signal in the daily chart is currently the valid one and it has a target of 409,xx. The intraday NR has hit its exit so that’s gone. The exciting question is how will the Short Term Trend look when the daily PR is done and last but not least the NR signal in the EOD chart from mid December.
Believe,
Welcome here and maybe you will add the Elliott waves so we might have a bit more emphasis on Elliott again. To get things started I have put the AEX from the recent “low” 498,97 on-line and attached a screen print (attachment 3) with the best scoring scenario. Mind you I use the original Elliott patterns and not the add-ons Bob Junior compiled and I presume are being used in the software you use. In the past I played with both and found differences in the analysis outcome so I picked the original thing.
Pacito,
Good work your compilation and given your earlier thoughts in the above posts I have a fairly good idea where you are coming from. Indeed the fun part is to see how the actual thing looks like there are no guarantees what so ever however you have a plan rather that the main lot that is shooting in the dark.
Remember Trade to WIN.
EDIT1: attachment 4.
Due to some time I had to spend with a representative of the insurance company related to the storm damage I was out for a couple of hours. And yes the cliché is true those guy’s are cowboys or secondhand car salesmen of the worst kind. Just thinking about it makes me furious so I better look at the stock market to relax.
A new intraday KVKD system has been constructed and see if we will get a confirmed trading signal this time.
Attachments
Last edited:
Dear Pacito,
Just have a look at the price/rsi at 22nd of december. If the AEX goes up on monday a PR might be there (target = 516).
Dear Clown,
I got lucky at the end of last week. I was a little bearish because of the momentum indicators. So when I was in for a quick lunch, I saw your picture, took a small short position at 504 and rushed off. In the evening when I got time to look at the AEX/S&P, I was not very happy. But I took a profit friday morning, then at the end of friday a long position at 498,5. I play bridge a lot and there is a saying that when evering goes well you are in heat 1 and must act on "feeling" and neglect the theory.
regards
Pacito said:Sorry, that one met its goal already. The RSI since january 10 can put a PR together when the AEX closes on monday lower but higher then 492,5.
Pacito
I was thinking of
22 dec RSI=55,119 AEX=490,77
19 jan RSI=65,656 AEX=507,12
26jan RSI=51,084 AEX=499,80
But then the RSI must be a low, so the AEX must close higher on monday.