Clown's 2007 outlook is work in progress

Atilla said:
Yes very much so in my opinion.

Use it with MA5 10 and 20. When upper or lower BBand is broken and price is above MA lines or below respectively is a good indication of brake outs.

You can get bear and bull traps but on the whole it's a strong very useful indicator to a move when it narrows.
I don't see the importance of the price being above or below the MA5 10 or 20, because these indicators will never cross the bollinger bands due to the fact they are using almost the same time as the bollinger bands. When the price is touching a BB then its bound to be above those indicators when touching the upper line or below those indicators when touching the lower line.
To put things together:
we seem to agree about the narrowing BB to predict a change. The direction of the change can be seen at touching the upper or lower line or at the overshoot, but also at the way the RSI, stochastics and the MA's behave.
Last but not least: a change in an uptrend promises a downturn. For as far as I know we discussed only about a downturn. The narrowing of the BB doesn't materialize in downtrends as an indicator for an upswing.
The only question that remains is: How wide is narrow? Is that 20 points, 15, 12, 10?
Or, what is the probability: 60% at 20 points, 70% at 15 points, 90% at 12 points, 98% at 10 points?
Probable subquestions: is there a relationship between the size of the narrowing and the size of the downturn? Is there a relationship between the length of the narrowing and the size of the downturn? Or is there only the fibonacci relationship between the range of the uptrend and the range of the downturn?
Pacito
 
john f charter in his book, mastering the trade uses b bands along withkeltner channels and momentum index oscillator to give him the squeeze set up for potential for big move.
 
morge middag bloas ik met enne paar moate in t Kielegat

Dear gentle People,

Enveloping a price or indicator in your charts can be done by a number of definitions of which the Bollinger Bands pop up frequently but mind you there are a number of others. The idea behind enveloping is that the prices moves within a certain tolerance both above and under the current price. The striking thing in the above posts to me is that you are all gambling on a move out of the bands whereas the idea of the bands is that the price would move within the boundaries.

Looking for clues the suggestion should in my humble opinion found in the combination of different indicators and/or techniques. And where a number of indicators show divergence the trend determination methods should be giving you the direction within the given boundaries. Note to watch from a traders perspective, in an upward trend the support area’s and in a downward trend the resistance area’s.

Even planet activity might provide an indication for what one should or better should not expect to see on the stock market. So to fill in the blanks I have attached the planet activity chart for the first half of 2007. Although the Clowndicator is more detailed it’s a fair impression of signals from space.

Have Fun and remember it’s Carnaval in the South. ALAAF.


EDIT:

What can I say but it is actually the 12th Harmonic which makes it 30 degrees in stead of the presumed 179. Since You seem to be a connaisseur I attached the detailed week chart for you so you will know exactly which planets are involved doing what each and every day of this coming week.
 

Attachments

  • aaa.jpg
    aaa.jpg
    580.7 KB · Views: 204
  • aaa.jpg
    aaa.jpg
    126.2 KB · Views: 190
Last edited:
The Dutch Clown said:
Dear gentle People,

Enveloping a price or indicator in your charts can be done by a number of definitions of which the Bollinger Bands pop up frequently but mind you there are a number of others. The idea behind enveloping is that the prices moves within a certain tolerance both above and under the current price. The striking thing in the above posts to me is that you are all gambling on a move out of the bands whereas the idea of the bands is that the price would move within the boundaries.

Looking for clues the suggestion should in my humble opinion found in the combination of different indicators and/or techniques. And where a number of indicators show divergence the trend determination methods should be giving you the direction within the given boundaries. Note to watch from a traders perspective, in an upward trend the support area’s and in a downward trend the resistance area’s.

Even planet activity might provide an indication for what one should or better should not expect to see on the stock market. So to fill in the blanks I have attached the planet activity chart for the first half of 2007. Although the Clowndicator is more detailed it’s a fair impression of signals from space.

Have Fun and remember it’s Carnaval in the South. ALAAF.

I can see that you are speaking at an angle of 179 degress but I'm not sure at which direction.

I'd be interested to know which planet your 179 degrees takes you to at your carnival. Do send us a post card back home... :LOL:
 
How did you get that book? More precisely, how did you find the time between the bull-bearfight to get your hands on this. I'm very interested what you will think of it after you read it.
Pacito
 
Thanks for putting the eggs in my basket. Did some sweating today, but I got the eggs undamaged.
Pacito
 
stuiteren

Nice to see in the first picture how the price bounced between the two lines today. The narrowing triangle will run out on March 6. In the second one there seems a resistance from the line through the tops. Will there be a change in trend and when? Earlier dates in January passed by without a change. Important dates could be March 6, March 19 and March 25. At the moment we are in the range 507-518, which comprizes 45 degrees. At a larger scale I hold on to the top of this year in the beginning of June. First , the path as I posted earlier has to be established, or revised.
Pacito
 

Attachments

  • price1.jpg
    price1.jpg
    354 KB · Views: 178
  • aex.JPG
    aex.JPG
    159.3 KB · Views: 194
Last edited:
gewoon weer nieuwe wedstrijden

Today the Bears are playing the 512,47 game the bulls have problems in their 507,35 game.


EDIT:
If you study the trending methodology as taught by GJN and you apply it within your trading you immediately notice the shortcoming of the methodology leaving you two options. So I took the thing and threw some creative thinking at it and ended up with something I call the Dynamic Range Rule RSI. The trend methodology ground rules will not change you only create trends within trends in order to control the trends even better or closer. So I have attached the most recent Dynamic Range Rule RSI in order to capture the trend within the trend and the picture is crystal clear.

Trade to Win.

EDIT2:
Trading is nothing else than anticipating and as far as the trend in the trend is concerned well just look at the attachment. And while you are at it don’t overlook the newly formed reversal signal.
 

Attachments

  • aaa.jpg
    aaa.jpg
    360.7 KB · Views: 222
  • aaa.jpg
    aaa.jpg
    114.1 KB · Views: 198
  • aaa.jpg
    aaa.jpg
    118.5 KB · Views: 189
Last edited:
Dax Full Speed Ahead

Most indexes seem to climb in a more moderate tempo. Only the DAX is performing at the same speed as last year. Will this be the leading index? Every TA that might point at a downturn in the other indexes is smashed by the DAX. Should we use the DAX to find a clue for a correction in the other indexes? I'm still convinced of my earlier postings about the path the AEX will follow, just because I have no new arguments to change my view. Maybe the DAX turns out to be the new argument.
Pacito
 

Attachments

  • aexpar.jpg
    aexpar.jpg
    308.1 KB · Views: 171
  • cacpar.jpg
    cacpar.jpg
    304.9 KB · Views: 163
  • daxpar.jpg
    daxpar.jpg
    357.4 KB · Views: 150
  • dowpar.jpg
    dowpar.jpg
    330.9 KB · Views: 160
  • isppar.jpg
    isppar.jpg
    327.7 KB · Views: 185
Week 9.

From an Elliott wave perspective nothing is changed yet and the wave pattern with the highest score still has its third wave up started at 470,54. It’s more the way the wave is performing (or better lacking to perform) that is feeding the serious doubt including the continuing Negative Divergence in a number of used oscillators.

From a time perspective quite a number of wave pattern alternatives are running out of time and I am beginning to think about a pattern that implies a fifth wave primarily due to the negative divergence in the used oscillators including the Elliott Oscillator. The financial astronomy is considered less seriously but it is a fact that the Retrograde Mercury is said to have the very same effect on the financial markets as we currently have. The Clowndicator shows two periods for 2007 where the long cycles have readings and that was early January (combined with December 2006) and the second is November/December. The highest value for the combined cycles gave a reading on February 10th and the multi million dollar question is: is the present stock market move due to the Mercury Retrograde effect or is the February reading a failure. To complete the time picture it is worth while mentioning that the only valid 4 year’s cycle low is due soon although one has to allow some tolerance when apply cycles.

If we consider the Technical Analysis signals both still active Positive and Negative Reversal Signals (see previous postings) play a role. As mentioned before from a technical analysis point of view the 61,8% retracement (703,18-217,80) level and 530 are the relevant price levels. So from the price view the multi million dollar question is: is the 61,8% retracement level the one that will act as turn or are we going to move to the next one.

In Yank’s Land the DJIA has already found a negative KVKD trending area system where the AEX is still in a positive KVKD system. Even though the eur\dol is doing its up most to perform the last piece of the 123move which itself is in sync with the Positive Reversal signals in multiple charts. The DJIA has shown three consecutive down day’s and will probably test the upper side of the KVKD - trending area in the coming day’s. Keep a close look at the eur\dol since this is the disturbance factor.

Let’s do an other cross check by quickly scanning the four main players that form the AEX; RDSA, ING, AAB and PHI. RDSA is negative trending and has to perform exceptionally to change that so the upside potential is short term and needs to convince first. AAB has been the bright star and seems to qualify more short potential than long. ING has failed to escape from the negative trending phase. PHI is trending positive and needs a confirmation.

From a traders perspective I would say we might expect to see more like we have seen last week and if you watch your charts closely you can already see the relevant clues in there. And especially for the Astro fans the Mercury Retrograde is still accompanying us for some two weeks.

Have fun trading to win.

PS.
Pacito the Clowndicator has an other high reading in June although the combined cycles reading is less than the February reading. In fact if I isolate the time cycles, the second long lasting one has the highest reading in June.
 
I'm glad the clownindicator also has june as a top. It is also a top in my calculations. See my expectation for 2007.
Pacito

Oh, how nice, the price is fitting itself into my path.
 

Attachments

  • 1.jpg
    1.jpg
    414.8 KB · Views: 163
  • 1.jpg
    1.jpg
    414.9 KB · Views: 154
Last edited:
Gewoon weer als een dief in de nacht.

The AEX decided to obey the “master” and leave the KVKD positive trending area with a gap this morning so we are in sync finally. One of the good old sayings is to never catch a falling knife however even a falling knife at some point will hit the floor or what ever you feel comfortable using. The thick red line is applying for the knife capturing job and when confirmed we are going to fill in the blanks.
 

Attachments

  • aaa.jpg
    aaa.jpg
    296.3 KB · Views: 217
gewoon lekker traden

Some people still dream of a positive trend by looking at a chart starting when my ancestors
were trading tulips in Amsterdam. For those of you I have some news, today we have the year
2007. Sweet dreams.
 

Attachments

  • aaa.jpg
    aaa.jpg
    220.2 KB · Views: 236
The question is: will this year look like 2004 or will it look like 2001?
Pacito

1 I'm not suggesting anything, but it strikes me again.

2 Will the price stay inside the channel?
 

Attachments

  • eurdoll.jpg
    eurdoll.jpg
    258.7 KB · Views: 206
  • 1.jpg
    1.jpg
    415.1 KB · Views: 187
Last edited:
Boingggggg

After the respectable downturn last week, what can be expected for the near future. Most downturns have three waves. The second wave can be up or sideways. During the last two years we had several downturns. The second wave took between 4 and 9 calenderdays. So, if the first wave has ended, which is not clear yet, than we can expect a 3rd wave down starting between March 8 and March 12. Wave 2 could be 38,2% of wave 1, being 11-12 points. 490 can be a resistance. Then down wave 3, which would end, being as long as wave 1 at 460. That would fit perfectly in my predicted path, however, a little sooner than I expected. Still hanging on to my path.
Pacito
 

Attachments

  • 1.jpg
    1.jpg
    415.1 KB · Views: 186
week 10.

Even tough the last weeks drop was expected some time ago the delay in time of it caused some disturbance and even the doubt popped up if at all. It’s all history and I sincerely hope you had a blast like myself. Something did change last week and the preferred pattern shows a wave 409,56-512,47 indicating a second wave down presently. Due to the serious price movement near the 38,2% retracement at 473,16 the wave counter signals wave 2 potential although it must be noted that the inter wave time relations are way off. In the back of my mind I am picturing a pattern with a wave III at 512,47 which would be the perfect fit for the 4 years cycle drop typical activity. Just a scenario to keep in mind when looking at the total picture for 2007.

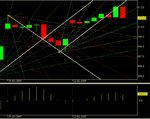
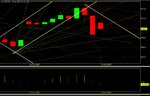
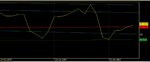
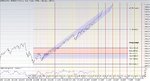
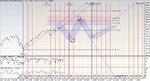
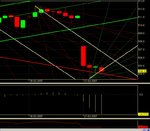
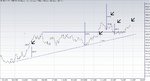
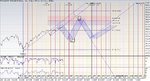
First things first and that’s the question whether or not the move down will be completed to fit in the above 38,2% retracement level even closer or will the AEX move up first to confirm the trend change from positive into negative. So let’s look at the preferred Elliott pattern from 512,47 for a minute and the picture tells more than a thousand words I refer to attachment 1. Just allowing myself one observation and that’s the wave IV at 486,19 on Friday morning and isolate that piece to take you one step beyond (Madness). And the surprise is complete if we look at attachment 2 leaving us the question what wave 5 will bring us: a) the normal version and b) the extended version. The riddle of the week now is for you to find the a and b answer since it has been published already last Friday.

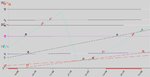
Given the close in Yank’s-land and more specific the movement after we closed it might be a fair estimate to presume wave 5:3:3 (see the attachments) to continue. So in preparing for the trades to win we need to cover two issues; 1) getting our act together for the wave 5 including the turn up 2) finding out as soon as possible the bigger picture. The first issue has already been covered so let’s move on to the second one: I have been implementing a more sophisticated piece of the puzzle in order to effectively re-engineer the RSI boundaries which I generate out of the home made dynamic Range Rule RSI. Mind you these values were calculated with last weeks EOD data so each and every completed day of week will change the values so when appropriate I might update them but let’s face reality. The first three levels of Range Rule Resistance (RRR) are the dynamic OS values at a Monday’s close 482,73 484,11 and 485,58. The second level of resistance is the dynamic Bear Range Rule value at Monday’s close 487,15 488,81 490,59 492,50 and 494,55. The next level is the level where the Range Rule Trend Change (RRTC)which I am not going to add here as I do not want to dazzle you with a huge number of numbers and values.

The tough part now is the trend and the way trends within the trend are captured even within the very same timeframe used. To avoid a debate whether the trend is positive or negative I will work out something like this for Monday: 9-10u rrt: - rrr = 479,84 rrtc = 482,53. And immediately the first interpretation issue pops up, the rrr value is below the close value of 17-18u on Friday so it should be support in stead of resistance. This is one I now – it’s Saturday morning – will not bother to explain rather than maybe suggest to wait until Monday morning.

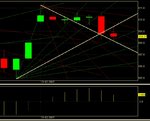
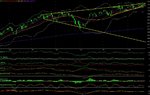
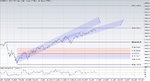
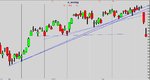
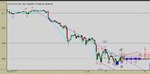
The observing reader might have concluded already that the hourly range rule trend readings could be used as a trailing stop-loss. There is however a vacuum area which exposed itself when trading last Friday when the AEX closed above the rrr level and below the rrtc level. Straight forward the rrt remains negative and the shorts could be left open the but however is your own gut feeling which tells you 30 index points down in a couple of day’s wow. So I have to turn to other techniques and or indicators for help here it doesn’t matter what I do or try there seems to be no single simple straight forward solution. So the 512,47 intraday trend can be captured as done so far quite successful with a Gann Fan and the AEX is below this line the above range rule trend readings even fit within the Fan which provides me the evolution route to follow.

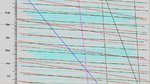
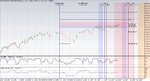
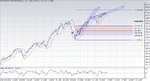
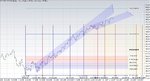
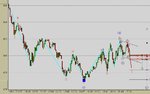
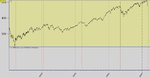
The last piece I contribute in this weekly is especially for those people that turn away each time the word Astro pops up even without the difference between Astronomy and Astrology. Reading bits and pieces on the first I can not avoid to pick up something about the second and it must be said that I am impressed with the Mercury Retrograde effect once again. So I told myself to be less reluctant towards the subject. In my Astronomy study’s I stumbled over something last week which I attached here as projected astronomy events in the bull run AEX chart starting in March 2003.

Have fun trading.
 

Attachments

  • aaa.jpg
    aaa.jpg
    180 KB · Views: 218
  • aaa1.jpg
    aaa1.jpg
    203.9 KB · Views: 241
  • aaa2.jpg
    aaa2.jpg
    210.2 KB · Views: 219
Top