You are using an out of date browser. It may not display this or other websites correctly.
You should upgrade or use an alternative browser.
You should upgrade or use an alternative browser.
tradesmart
Experienced member
- Messages
- 1,286
- Likes
- 22
Anyone bought the Dow at around 120ish?
Managed to close my Friday long at 210 today (lucky with all the bad news about!) and went short.... 😎
Now suspicions of a double-bottom appear to be well founded, so having another try long with a tight stop (but of course, watching for the warning signs of another leg down...... 😕 )
Managed to close my Friday long at 210 today (lucky with all the bad news about!) and went short.... 😎
Now suspicions of a double-bottom appear to be well founded, so having another try long with a tight stop (but of course, watching for the warning signs of another leg down...... 😕 )
frugi
1
- Messages
- 1,843
- Likes
- 133
5 waves down on 5/10 min chart. 123 setup building on ES at lower pivot. Good vol div on ES 30 min dbl bottom with lots of PD as Mom mentions.
But what fun it would be for the big boys to take out a multitude of stops below the dbl bottom before taking off upwards. 🙁
But what fun it would be for the big boys to take out a multitude of stops below the dbl bottom before taking off upwards. 🙁
tradesmart
Experienced member
- Messages
- 1,286
- Likes
- 22
47 points in 5mins - nice......none of this is rocket science....but....
WE HAVE LIFT OFF..............!!!!!!!!!!!!! :cheesy:
WE HAVE LIFT OFF..............!!!!!!!!!!!!! :cheesy:
"Houston, we have a problem!" 🙂
Wonder how many trader/risk capital is looking at this market with view of going long of lows (eg pick the bottom) and push market up into Fridays' expiration. Options market makers would certainly minimise pay-offs on sold putoptions. It would be very suprising if the market isn't going up next few days. Too much at stake for the big boys!
For now, is this a bottoming pattern or a cruel bearflag? On the 10min chart it seems that there is a bit more leeway down before PD in RSI, MACD and CCI get violated.
tradesmart
Experienced member
- Messages
- 1,286
- Likes
- 22
bgold - yes, when 'what goes up' comes straight back down, it does demonstrate a certain lack of conviction....... 😆
suspect we might see some geometry in the making now.....
suspect we might see some geometry in the making now.....
This market is climbing a wall of worry!
We've had 2 1/2 hours of higher lows and I am still not scoring any points. Stopped out again. And I wasn't alone in YM stop at 121 was filled at 118!! That's no fun.
Do I see an ascending triangle? Or is there more to this picture?
We've had 2 1/2 hours of higher lows and I am still not scoring any points. Stopped out again. And I wasn't alone in YM stop at 121 was filled at 118!! That's no fun.
Do I see an ascending triangle? Or is there more to this picture?
Guys, don't guess the bottom... The Bears have us all by the bulls 🙂
It's close- 3 day divergence in CCI and a distinct failure to make support on the 10 min gives us a small hope of a bottom. WE need to come out the other side with something a bit more positive, like a clear D /bottom, a "W" or Inv H&S so we can get a target by which we can determine up or continue....
It's close- 3 day divergence in CCI and a distinct failure to make support on the 10 min gives us a small hope of a bottom. WE need to come out the other side with something a bit more positive, like a clear D /bottom, a "W" or Inv H&S so we can get a target by which we can determine up or continue....
Attachments
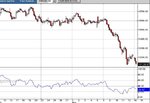
Not much of interest really, save BG's comments about tracking higher lows... what else can can you do? Tread carefully , I guess, and use smaller stake sizes whilst there is uncertainty. The interesting thing today is the late up channel that showed the failure mechanism by way of not making resistance ( or support for a bull break). Much the same as can be often seen in triangle breaks from time to time. So what? Well, you can close a long for minimum loss, or take a short.... The same can be seen earlier as the price hit "rock bottom" at 10,111. This time, support failed to make it.
Attachments
tradesmart
Experienced member
- Messages
- 1,286
- Likes
- 22
After the severe falls of the last week culminating in yesterdays rout, it doesn’t take much foresight to suspect that we may have a decent bounce soon, and the big picture confirms that we are now in a historic support area….
But as usual, climbing the “wall of worry” has immediate obstacles to confront, namely the FOMC meeting on interest rates today, the details of which will be released at around 19.15 this evening…….(it’s not what they say, it’s the way they say it…….! 😉 )
But as usual, climbing the “wall of worry” has immediate obstacles to confront, namely the FOMC meeting on interest rates today, the details of which will be released at around 19.15 this evening…….(it’s not what they say, it’s the way they say it…….! 😉 )
Attachments
Hi Chaps,
These are my thought fwiw :
I figure we are in a downtrend - dunno how long or how far, but still down.
Weekly Charts - we've broken the bottom trend line - resistance @ 10,240 based on 20 EMA
Daily Charts - Broken thru 100 EMA. Resistance at ~10,220 (100 EMA). Support down to 9850 (200 EMA)
60 min chart - Resistance at 10,140. Support at 10,100 based on yesterday.
10 min chart - We had a bo of a descending triangle yesterday. Doesn't look like its gonna meet target 'cos futures r up today - unless its a pullback to tri base.
Overall, expecting a bounce today - ie a pullback on the longer term downtrend 🙁
TS, I think your right for an upmove, many people seem to expect it. Just in case it falters we have weekly suport at 10077-80 from may 2002. Something to watch out for, may not be significant.
ANother good trader I follow thinks that if this goes then we should be in for some good selling.
ANother good trader I follow thinks that if this goes then we should be in for some good selling.
tradesmart
Experienced member
- Messages
- 1,286
- Likes
- 22
Anmol – Certainly the market has been severely spooked by recent events, so it’s not a time to take too much for granted, including a significant bounce – merely a possibility. Maybe the ‘bottoming’ pattern is not complete…?
But it’s never a one way ticket – will still be looking to play the intraday moves in both directions according to the signals……
But it’s never a one way ticket – will still be looking to play the intraday moves in both directions according to the signals……
- Messages
- 2,325
- Likes
- 17
We're going to get some fun and games today - FOMC meeting with interest rate announcement at 14:15ET. Roller coaster time, seatbelts essential. :cheesy:
Identifying High Probability Trade Set-ups in the CBOT mini-sized Dow Futures - March
Please find below a copy of circular from CBOT promoting YM contract. Look like volumes are up (eg we are doing a good job creating liquidity).
Perhaps of interest to dedicated follower's of CM's threads is the webseminar set for tomorrow night with topic:
Identifying High Probability Trade Set-ups in the CBOT mini-sized Dow Futures - March 17, 2004 @ 3:30 CST / 4:30 EST
regsitration on:
http://www.cbot.com/cbot/pub/cont_detail/0,3206,1058+17687,00.html
CBOT Dow Complex, mini-sized Dow Futures Shatter Previous Volume Records
Mini-sized Dow futures traded 155,922 contracts on Thursday, March 12, 2004, while the Dow Complex traded 200,056, up 50% and 79% from previous records. Go>>
--------------------------------------------------------------------------------
LIVE WEBINARS:
Identifying High Probability Trade Set-ups in the CBOT mini-sized Dow Futures - March 17, 2004 @ 3:30 CST / 4:30 EST
Join Mark Likos, senior financial analyst, firetraders.com, as he discusses high probability trade set-ups for mini-sized Dow futures. Register now.
Using Position Data to Trade CBOT mini-sized Dow Futures & Options - March 24, 2004 @ 3:30 CST / 4:30 EST
Eric Wall, Senior Account Specialist at Man Financial discusses how to use daily position analytics in day trading, position trading and option plays. Register now.
CBOT TMI Futures - The Index & The Futures Contract - March 31, 2004 @ 3:30 CST / 4:30 EST
Join John Prestbo, of Dow Jones, along with the Chicago Board of Trade, as they discuss the Dow Jones U.S. Total Market Index (TMI) and the recently launched CBOT TMI Futures contract. Register now.
--------------------------------------------------------------------------------
Record Single Stock Futures Volume on One Chicago
Weekly volume at OneChicago reached a record 325,768 contracts for the week ending March 13. Exchange open interest also hit a new record of 297,282 contracts March 11.
Twenty-one different OneChicago products traded more than 5,000 contracts March 9 and eight more traded more than 5,000 contracts March 10.
OneChicago has a total of 110 products: 95 single stock futures, including futures on the DIAMONDS Trust, and 15 futures on the Dow Jones MicroSector Indexes. Go >>
--------------------------------------------------------------------------------
Margins:
Stock Index Group
Maintenance Margin (per contract)
Initial Margin (per contract)
Dow ($10 multiplier)
$4,000
$5,000
mini-sized Dow ($5 multiplier) $2,000 $2,500
TMI ($500 multiplier)
$4,000
$5,000
The CME/CBOT Common Clearing Link (CCL) now offers reduced margin requirements for equity index cross-exchange spreads. For a 3:1 Dow Jones:S&P 500 futures spread this can means a spread credit reduction of 95%.
Similar threads
- Replies
- 1
- Views
- 2K