Dow Intraday charts 15/Mar - 19/Mar

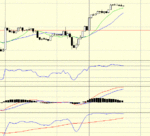
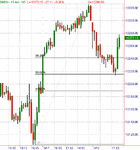
Is this a bull flag, targetting 10323 which shows on my 10min chart as 0.382 correction of 10695-10094 decline?

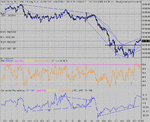
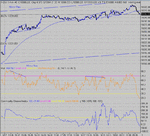
I am overnite long YM from 129 (making back many false starts in past few days), stop now at 221 and wonder whether to scale up but can't really find an entry signal?

Any suggestions?
 
Looks ok so far, stop in at 55... 250 was the crunch. next res 320. The time to add would be after any pullback to 60 area...
 
begining to look shortable on the dow.....imo


my 5 min chart is squeezed so much in needs either pop and drop or a decent pull back at least. This is my 10 min
 

Attachments

  • hhjs.gif
    hhjs.gif
    52.5 KB · Views: 337
Last edited:
They have ignored the news of the bomb in Iraq so far. Looks like a big one this time.
 
As DOW is approaching 320, I see divergence is 1min RSI. Can't really call it ND but looks as if market needs to correct a bit longer before attempt can made for a real push upwards. If ever?
 
also, the 60 min daily hitting 50EMA for some resistance. Couple that with 10,320 horizontal resistance and time to quit?
 
Good call CM, 320 made easily (and a bit more......! :D )

next stop 425.......!?

(not that I'm biased in favour of those with bullish Dow Comp entries of course....... :cheesy: )
 
Yes, 320 wasn't too hard to call... 449 by Friday close is possible- that would make my first Comp points in weeks :( I might even have a little punt on that .:)
I suppose that the bottom could loosely be a "W" with a target of 300.We've got there, so we have to push up to continue the move, IF that's where we're headed. I've put in the Fibs, just to get another fix on things.
 

Attachments

  • dow 17-03-04 10.gif
    dow 17-03-04 10.gif
    41.7 KB · Views: 422
You can see the Fib lines in a little more detail- spooky how it slammed up to 38% and stayed glued to it.... Divine Providence or a fluke? Does your choice of the high/low matter? Sure. Choose 750 and you get a different answer of course. Will the extreme weakness in the final drop mean we'll gap up tomorrow?
Nothing too exciting today,save the closing bull flag that failed support to give a final push to 325. Target was 315. You'll have to wind the chart up to see it...
 

Attachments

  • dow 17-03-04 1.gif
    dow 17-03-04 1.gif
    26.1 KB · Views: 410
CBOT High Prob DOW breakout web seminar

Anybody joined the CBOT webseminar.
I thought very educational. Emphasis on high probability trades using breakouts, value ranges etc.

Check it out on the CBOT website.
www.cbot.com/dow click trading resources and in Daily DOW Analystics try FireTraders.com
Get there all "Key Trading levels" (for free).

I think it will help me improve trading performance.
 
I tried very hard!!! The test setup at work was fine, the home setup failed miserably as it did for quite a few people judging by the number of people in the tech support room. Spent ages in there but got nowhere. :( :(
So much for the gap up, we're 40 odd down .....
 
Sorry to hear. They did have some problems but I understand some time next week it will be accessible on the CBOT website.
 
did somefing i haven't done for a long time - went short at 310 just before close on :

a) hitting 320 horizontal support
b) hitting 60min 50 ema
c) expecting a consolidation (ie downy bull flagy thingy) day today 'cos of the rise.
d) still think trend is down and this is a pullback towards the daily 50 EMA.
 
I closed my overnight short at 250 - quite chuffed really :)

Just a thought, but have noticed recently that S/R lines have been setup by various MA's as opposed to the usual trend lines we use.

In theory, I could have closed my short around the 230 mark 'cos that's where the 60min/20EMA etc support was.
 
MOM,

Well played on the short.

Looking back at yesterday the market seemed to move very slow until right at the end, and it just managed to touch the fib levels on the dow,spx,ndx, comp, sox and the banking index (bkx)also.

Taking the fib levels from the day spx made a high of 63 on 5th March.

WIth so many Fib levels just being reached and then a pullback towards the end of the day, it made good sense to short.

Something I will remember to have a look at more in the future.
 
Mom

Agree with your point on S/R outside the round numbers 100,200,300 the market has not given us any clues from recent S/R.

Until we see a break of either 100 or 300 we seem to wandering in some kind of void and MA's have worked well.

Which way next..........?

We have had 3 attempts to break below 100 and 2 to get back above 300, the way things look at the mo it could soon be 3 each .........extra time and penalties maybe to find a winner :cheesy:
 
Anyone on trendline alert….?!

Apparently all it really wanted to do was a 50% retracement of the big 10100 – 10325 move, then off like a rocket from 220 ish with PD on the 10min chart to give the clue…….
 

Attachments

  • 18-03-04.gif
    18-03-04.gif
    16.2 KB · Views: 332
Yes i'm watching it.
 

Attachments

  • indu1.gif
    indu1.gif
    12.3 KB · Views: 260
Top