Dow Intraday charts 15/Mar - 19/Mar

But what fun it would be for the big boys to take out a multitude of stops below the dbl bottom before taking off upwards.

Good call from Frugi yesterday - exactly what they did, suddenly taking it below support at the close yesterday.... :confused:

and now a huge 115 point spike up in 6 mins to take out short stops........!

These guys know what they're doing....... :cheesy:

No position at the moment until the 'mist' clears....
 
i went for a quick short at 210 but then chickened out for a few points :(

now waiting for bounce of 100 MA to go long

maybe

:)
 
Triangle building on the 1min chart....?

I've got a suspicion this wants to test 230......

edit 17.07 - 230 - don't ask me what day.....! :confused:
 
Last edited:
Ok, it's not the triangle but bull flag pattern still holds. Watch out though, unlike DOW the ES did not make it to top of channel/flag.

Is the market going to fill this mornings' gap?
 
guess i shld have hung onto my shorts ...

not seen anything like this before - normally u get a flat run up to the announcement.

scary isn't it?
 
So what's this?

I see DOW & ES bounce of 61.*% retracement from yerterdays' low and todays' high and PD on the 1min charts! That's bullish.

But, I also see a bear flag on ES and DOW and a bear channel can be drawn.

Furythermore, NDX is almost back to yesterdays' lows and small cap ($RUT) is down 0.7%. serious underperformance, especially after yesterdays' 1.2% underperformance vs ES!

Basically, while verdict in our beloved DOW is not yet out, it seems to me that the tide is still falling.
 
There's a fine line between PD, which we have, and RSI moving up so that there is enough room for a drop!
 
Well, the Nasdaq Comp has certainly come back down to fill the gap and is now lower than yesterday's close - will the Dow follow suit.......?!

Seems to be weakening........ :confused:

The thought of more soothing words from Sir G is not inspiring the markets........ :LOL:
 
Anyone catch any of the 'FED' whipsaw...?!

Went short at 195 and covered at 157 3 mins later.......

First time I've tried it.......... :eek:
 
The 3 spike rule TS, I went short on the third spike, ym 133, but it made better sense to short as you did.

Looking for 10080ish?

Anybody do binaries with IGindex?
 
Last edited:
Anmol - hard to predict - long from 105 just closed at 130.....

the phrase "the quick or the skint" comes to mind......(have I modified that slightly....... :cheesy:)

ride the roller-coaster and try not to fall off....... ;)
 
Pure luck I can assure you - might have a packet of pork scratchings with the shandy later to celebrate....... ;)

(just keeping things in perspective....... :LOL: )

ps - I see the Nasdaq has found another cliff to fall off....!?

pps - back from the brink now and steaming into the green.....a true roller-coaster session.

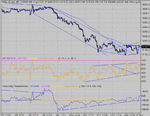
The Dow seems to have finished its bottoming geometry, courtesy of yet another triangle (we might have known...!)
 

Attachments

  • 16-03-04a.gif
    16-03-04a.gif
    15 KB · Views: 448
Last edited:
Yes, looks to have bottomed.... But 250 has to go if we want some upside... 4 days divergence now and an RS switch on the price.
 

Attachments

  • dow 16-03-04 10.gif
    dow 16-03-04 10.gif
    27.4 KB · Views: 456
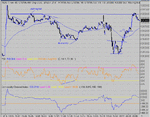
Much dithering and waiting for the news... But a couple of easy ish entries... one off the failed bull flag, the other off the PD bottom , then a bail out before the news. Third entry from the "W", ( except for those with a twinkle in their eye) with a target of 60 (+30) and going on to 200 and HOD for an exit just before the close....
 

Attachments

  • dow 16-03-04 1.gif
    dow 16-03-04 1.gif
    26.6 KB · Views: 457
Hi folks,
Would the rsi/price ratios have provided some clues for traders today?
I notice the move up from the 45min PD was ~2:1 (v.weak) but the rally back from the double bottom just before 20:11 was ~0.5 ish (strong).
Has anyone tried setting up a RSI/PRICE ratio indicator on SC? maybe useful, I'll probably have a go anyway out of interest.

Cheers,
Neil
 
Top