The Dutch Clown
Established member
- Messages
- 592
- Likes
- 11
In this thread it is welcomed to participate in discussions on different techniques based on bidirectional communication. Just dropping a question and pushing for an answer will not receive a response. If you put some effort in defining and putting together different arguments we are in for constructive discussions. If done so you will find a discussion partner in Clown on subjects like Technical Analysis both old and new school both ordinary and advanced. To start-up constructive discussions I have put together some thoughts from different angles.
One issue I would like to put up for simple Y\N discussion and that’s the used language. Requested by one or two native English traders I changed from Dutch into English but I have noticed that the response here is of primarily Dutch origin. So I am wondering if we perhaps should change to Dutch and continue in Dutch.
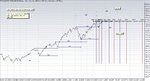
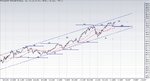
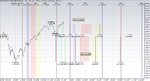
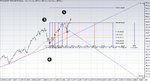
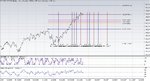
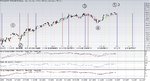
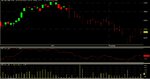
For quite some time now the AEX is moving trending up and if we look at the long term Cycle Analysis perspective this uptrend will continue. This of cause does not mean that a correction is out of order or even something like the four year’s cycle drop. In fact if you look at the DJIA you will find that the average 4 year’s cycle drop since 1897 is about 31% and for the time indication you will have to use the AEX bottom as reference which is in line with the 56 years cycle. Some of the market watchers want to believe that the 4 years cycle drop has already happened so do your own statistics and conclude that the supposed 4 years cycle drop in that assumption is a) way of the average 4 years cycle drop and b) even less than the smallest drop in the last 100 years of 4 years cycle history. So I only conclude that it’s a possibility rather that a fact. Even Gann did something like Cycle Analysis although I have not yet found the conclusive answers to what and how Gann did perform his Cycle Analysis. The mother of this type of analysis is the historical data chart of the DJIA which has it’s first data entry January 1897. (attachment 1) If we follow his findings – or I should say my present understanding - I end up with two different angles so if I project that we need to take in account a serious correction due in 2007 and the 2007 chart to work with looks something like attachment 2. This 2007 projection is not a Holy Grail but more something like a worksheet that needs continues work in progress specifically on the turning points and the high and low values. The very same warning you find attached to each financial product is applicable, past performance is no guarantee for future performance.
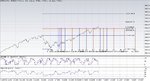
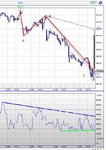
From an Elliott Wave angle we still favor – meaning that this scenario has the best overall score when reference to Mr Elliott his findings - the five wave scenario starting at 217,80 with the fifth wave up from 409,56. So this angle is allowing some additional upwards potential in both price and time. Let’s forget the challenges of this preferred scenario for now (it has been discussed in some other threads) and just focus on the direction of the highest wave label which is up. It has already been said here that the preferred Elliott scenario frequently is not the one that you will be ending up with so you will have to take alternatives into account. Or cross the results with other techniques like trend potential and put the 217-500 performance in that perspective. If we combine this with the KVKD system we find that a wave three might still be active and the picture might be different in the near future nothing to worry about right now. And this last scenario fits the extended Long Term outlook from the Cycle Analysis.
The Astro Financial Analysis still did not deliver what I would like it to contribute. It is one thing to be able to check the self-imposed Guru’s by analyzing the facts or even translate from Dow to AEX and find out that until now what I have seen are the leftovers from a Bull. The outlook of our Blond Dutch former AAB Vamp who merely translates a US view changes too often and damages the Astro Financial Analysis, I just can’t believe that it’s true that there are people paying for this service. I consider that the destructive route whereas I would like to walk the constructive route in order to use it positively. Once again I find myself walking alone on the road and this one is extremely labor intensive so I do not seem to be making any progress at all. The present direction is the crossing of Cycle and Astro Analysis because it seems to me Gann is pointing in that direction.
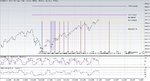
Last year I have developed the KVKD system which is based on basically a combination of Gann, Elliott and traditional Technical Analysis and it provides Trending Area’s including the Trend Potential. The KVKD system therefore effectively qualifies the trend and indicates potential trend reversal area’s in time and price. These potential trend reversal area’s qualify for improvement. What I am looking for is additional functionality that isolates the potential trend turning points, limits the number of them and qualifies their relevance including the level of the turn. In my humble opinion the crossing of Cycle and Astro Analysis should do the trick but the how exactly is still bothering me. So once again I find myself writing code and facing the inevitable challenges I said to myself I do not want to face anymore. Honestly I have to admit that I have learned a lot about Gann in my last programming tour so it was worth while doing any hard coding bit and I am learning again.
If we look at the wave count starting at 409,56 the best scoring scenario is one that has an impulsive wave on 498,45 and a second wave at 470,54 which implies we now have wave three up. Here we need some of the other techniques where a Negative Reversal is found in the EOD chart and the signal is still valid even Negative Divergence has been added to the picture. So unless the Negative Reversal Signal is being taken out we seriously will have to be taken in account that the second wave has not been completed yet. To complete the picture it has to be mentioned that a complex pattern does not imply that the target should take out the 470,54 it’s a possibility not necessarily. And to wrap things up the Positive Reversal signal is still alive and kicking keeping the 512 spirit amongst the GJN flock that blindly throws itself into long positions.
Every once in a while I find myself struggling with an overload of information generated by the many techniques I use. Even straight forward ones like Negative and Positive Reversal Signals seem to fall in that category, there are simply too many signals, of course providing one is able to find the signals. This has become my call to change the use of the used technique by integrating a validation and qualification process. Wondering why this Range Rule works in situation a) but does not work in situation b) assuming that I am able to identify a) and b) anyway.
As opposed to some limited views I do prefer to anticipate on movements and turns in direction simply because it provides me the up most ideal trading signals according to Rule number 1 out of Clown’s Trading Almanac. It has to be said that the facts will have to rule and not the wishes, hopes and expectations in order do perform the trades to win. It’s just the difference between the Analyst who gets paid to just analyze and the Trader who makes his money trading the markets. The entry point of a trade is the most important since if calculated correctly provides the Trade to Win each and every time.
Think about it and remember to Trade to Win.
Disclaimer:
This contribution is for educational purposes only.
Attachments:
1. The DJIA historical data file.
2. The 2007 projected work chart version December 2006.
One issue I would like to put up for simple Y\N discussion and that’s the used language. Requested by one or two native English traders I changed from Dutch into English but I have noticed that the response here is of primarily Dutch origin. So I am wondering if we perhaps should change to Dutch and continue in Dutch.
For quite some time now the AEX is moving trending up and if we look at the long term Cycle Analysis perspective this uptrend will continue. This of cause does not mean that a correction is out of order or even something like the four year’s cycle drop. In fact if you look at the DJIA you will find that the average 4 year’s cycle drop since 1897 is about 31% and for the time indication you will have to use the AEX bottom as reference which is in line with the 56 years cycle. Some of the market watchers want to believe that the 4 years cycle drop has already happened so do your own statistics and conclude that the supposed 4 years cycle drop in that assumption is a) way of the average 4 years cycle drop and b) even less than the smallest drop in the last 100 years of 4 years cycle history. So I only conclude that it’s a possibility rather that a fact. Even Gann did something like Cycle Analysis although I have not yet found the conclusive answers to what and how Gann did perform his Cycle Analysis. The mother of this type of analysis is the historical data chart of the DJIA which has it’s first data entry January 1897. (attachment 1) If we follow his findings – or I should say my present understanding - I end up with two different angles so if I project that we need to take in account a serious correction due in 2007 and the 2007 chart to work with looks something like attachment 2. This 2007 projection is not a Holy Grail but more something like a worksheet that needs continues work in progress specifically on the turning points and the high and low values. The very same warning you find attached to each financial product is applicable, past performance is no guarantee for future performance.
From an Elliott Wave angle we still favor – meaning that this scenario has the best overall score when reference to Mr Elliott his findings - the five wave scenario starting at 217,80 with the fifth wave up from 409,56. So this angle is allowing some additional upwards potential in both price and time. Let’s forget the challenges of this preferred scenario for now (it has been discussed in some other threads) and just focus on the direction of the highest wave label which is up. It has already been said here that the preferred Elliott scenario frequently is not the one that you will be ending up with so you will have to take alternatives into account. Or cross the results with other techniques like trend potential and put the 217-500 performance in that perspective. If we combine this with the KVKD system we find that a wave three might still be active and the picture might be different in the near future nothing to worry about right now. And this last scenario fits the extended Long Term outlook from the Cycle Analysis.
The Astro Financial Analysis still did not deliver what I would like it to contribute. It is one thing to be able to check the self-imposed Guru’s by analyzing the facts or even translate from Dow to AEX and find out that until now what I have seen are the leftovers from a Bull. The outlook of our Blond Dutch former AAB Vamp who merely translates a US view changes too often and damages the Astro Financial Analysis, I just can’t believe that it’s true that there are people paying for this service. I consider that the destructive route whereas I would like to walk the constructive route in order to use it positively. Once again I find myself walking alone on the road and this one is extremely labor intensive so I do not seem to be making any progress at all. The present direction is the crossing of Cycle and Astro Analysis because it seems to me Gann is pointing in that direction.
Last year I have developed the KVKD system which is based on basically a combination of Gann, Elliott and traditional Technical Analysis and it provides Trending Area’s including the Trend Potential. The KVKD system therefore effectively qualifies the trend and indicates potential trend reversal area’s in time and price. These potential trend reversal area’s qualify for improvement. What I am looking for is additional functionality that isolates the potential trend turning points, limits the number of them and qualifies their relevance including the level of the turn. In my humble opinion the crossing of Cycle and Astro Analysis should do the trick but the how exactly is still bothering me. So once again I find myself writing code and facing the inevitable challenges I said to myself I do not want to face anymore. Honestly I have to admit that I have learned a lot about Gann in my last programming tour so it was worth while doing any hard coding bit and I am learning again.
If we look at the wave count starting at 409,56 the best scoring scenario is one that has an impulsive wave on 498,45 and a second wave at 470,54 which implies we now have wave three up. Here we need some of the other techniques where a Negative Reversal is found in the EOD chart and the signal is still valid even Negative Divergence has been added to the picture. So unless the Negative Reversal Signal is being taken out we seriously will have to be taken in account that the second wave has not been completed yet. To complete the picture it has to be mentioned that a complex pattern does not imply that the target should take out the 470,54 it’s a possibility not necessarily. And to wrap things up the Positive Reversal signal is still alive and kicking keeping the 512 spirit amongst the GJN flock that blindly throws itself into long positions.
Every once in a while I find myself struggling with an overload of information generated by the many techniques I use. Even straight forward ones like Negative and Positive Reversal Signals seem to fall in that category, there are simply too many signals, of course providing one is able to find the signals. This has become my call to change the use of the used technique by integrating a validation and qualification process. Wondering why this Range Rule works in situation a) but does not work in situation b) assuming that I am able to identify a) and b) anyway.
As opposed to some limited views I do prefer to anticipate on movements and turns in direction simply because it provides me the up most ideal trading signals according to Rule number 1 out of Clown’s Trading Almanac. It has to be said that the facts will have to rule and not the wishes, hopes and expectations in order do perform the trades to win. It’s just the difference between the Analyst who gets paid to just analyze and the Trader who makes his money trading the markets. The entry point of a trade is the most important since if calculated correctly provides the Trade to Win each and every time.
Think about it and remember to Trade to Win.
Disclaimer:
This contribution is for educational purposes only.
Attachments:
1. The DJIA historical data file.
2. The 2007 projected work chart version December 2006.