Clown's 2007 outlook is work in progress

Daar gaat ze.......

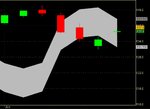
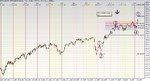
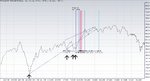
The Yanks did what they were supposed to do so we are equipped with a push in the direction of the thresholds that need to be taken out to move forward. If due course the dynamical short term intraday trend boundaries are moved above the 530,80 we are comfortably on track. At this stage you would probably keep the familiar retracement levels in mind for some guidance. This Friday we have the monthly expiration again and some uncertainty might get grip on trading, personally I skipped June series last week and got several July options on board.

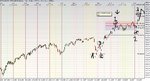
As Rentenier pointed out there is a distinct ABC pattern possibility so the thing to watch this coming trading week are the relevant levels that will either confirm or rule out that scenario.

Have fun trading to WIN.

EDIT:1
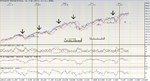
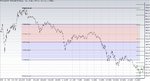
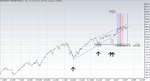
Let’s make no mistake about it we are not out of the woods yet and however you might feel about page 58 you just can’t ignore the existence of it and the actual effect on trading. The first hour of trading the FTI found the critical threshold and was not able to pass it so we were left in no-man’s-land waiting for the price/time matrix to built up enough momentum to get things done. The critical threshold was built by the accumulation of multiples which are now split so might be less solid compared to this morning. An attempt to cover one of them failed and the AEX is now struggling with one of the 530,80 trend lines for support levels. So let’s take it one step at a time, the first one is the support confirmation and when that’s in we can focus on the threshold levels. It seems to me we need some assistance from the Yanks again just curious if they can deliver so punctually this time.
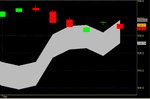
 
Last edited:
Dinsdag 12 Juni ... op zoek naar de impuls

The price/time matrix indicated that Monday would be too soon to get the thresholds down so the best thing you might expect is getting some work done in the dynamic short term trend area. The lower boundary has been lifted above the 530,80 so this implicates that if the trend changes from positive into negative it will be a hard exit for the last week opened long positions.

The auction close took care of the first threshold and if it has been taken out will have to be shown on Tuesday, you might want to check the Derivative Oscillator. The more important clues can be found in the EOD chart and don’t forget to have a look at the ADX as well. I have attached the projected range fractal EOD trend chart for some guidance.

Have fun trading to WIN.
 

Attachments

  • aaa.jpg
    aaa.jpg
    121.8 KB · Views: 179
Woensdag 13 juni

Shaken not Stirred (yet)

The thresholds prove to be tough nuts to crack by the AEX and the intraday short term trend changed to negative so we were thrown right back to where we started last Friday. The intraday volatility was almost perfect within the signaling so you were offered nice trading opportunities. Looking at your charts you will find a lower high and a higher low which will not help you through the trading day so you will have to find a way to qualify and/or quantify the trends starting at those relevant pivots. The price/time matrix has built up substantial up potential for the price so it’s about time that some of those thresholds are taken down. Does this mean it can’t go any lower, well it can of course and even consider one of the beauty entry signaling.

The EOD chart is becoming a bit worrisome as might be shown by the attached projected range fractal EOD trend chart.

Have fun trading to WIN.

EDIT:1
The AEX has arrived in the bonus signaling area now the actual signal first has to be accomplished.
EDIT:2
The actual bonus signal has been realized so within the set boundaries some trading can be done. To add some cryptically chips you now should be looking for a signal within the set bonus signal. Be advised to follow your signals strict without any hesitation.
@Rentenier
The weekly chart has been the one that indicated the limited up potential some time ago however remained positively trending according to the dynamic short term trending methodology. Since than the weekly chart has created some negotiating margin to please the Bulls. If the AEX value of this morning is also the close at the Friday week close that trend will change into negative so we have some margin left. To me more worrisome is the EOD chart and more specific a rising threshold that is today around the 542 level. The intraday chart will tell us shortly when the declining threshold is met, currently at the 534 level, it is however an area where several resistance levels meet.
EDIT:3
Boem…that’s the one. No Sir I won’t ask you to blow since the answer is not blowing in the wind. Just now focus on the support levels or “aanloopje”. Needles to add what happens if they don’t hold.
 

Attachments

  • aaa.jpg
    aaa.jpg
    127.8 KB · Views: 183
Last edited:
Looking at the week chart, one can find a TDtrendline which is recently broken. The picture shows this trendline (yellow) in the day chart. It is not perfect, because 2 days are below the trendline, but the bodies of the week candles are above the line. The target of the breakout is about 508. I would not be suprised if we reach this level in the near future. But the breakout may be a false one, so be careful.

EDIT:

Today a new TDtrendline has developped with an upward potential of 11 points (brown line). If we break the trendline (which seems likeliy to occur given the situation in USA), then the new target is 446. That target may be a sort of backtest of the yellow line, so the yellow target may still be valid, but the purple target will be cancelled.
 

Attachments

  • aex20070612.gif
    aex20070612.gif
    42.3 KB · Views: 189
  • aex20070613.gif
    aex20070613.gif
    34.9 KB · Views: 205
Last edited:
Donderdag 14 juni af en toe eens op een knopje drukken en het geld stroomt binnen

The Wednesday morning bonus signaling was an example which could be right out of a textbook on trading, the combination of signals has yet to be written and you, being an assertive reader, just find it here on the Net. The last trend line from the 538,65 pivot was functioning as resistance on Wednesday so let’s see what the Yanks did for this one. The relevant levels are mentioned in the above posts so I wouldn’t repeat them here I am just going to enjoy the ride. The attachment is the familiar daily chart.

Have fun trading to WIN.

EDIT:1
One adagium I live by in my trading life is a trader is as good as his next trade so when the present one is still running I am thinking about the next. Carefully studying the charts for clues to support the next move and running through numerous alternative scenario’s to end up with the P ones. The arrogant sun of a gun I am I keep an extremely tight stop-WIN just waiting patiently for it to hit.
@Pacito.
Hope you would like to reconsider your view on page 58 since you currently have one close to the overbought zone. Mind you the “inverse meaning” implicitly is linked to my stop-win. From an analysis point of view the charts offer something interesting.

EDIT:2
Given the challenging charts I did not hesitate and closed my longs when the stop-win was hit at 15u. Looking for an additional swing so first let’s see what the Yanks are going to bring to the table if not well just take the next beautiful one.

Cheers.
 

Attachments

  • aaa.jpg
    aaa.jpg
    112.4 KB · Views: 206
Last edited:
closed also my calls at 543.40
wauw, this was a one from 'et boekie'.
really enjoyed it and thanks for the comments.

( i am for a small position on the short site at now)

@rentenier : i'am almost sure you meant 546 (446)

heute mittag (todays afternoon)
 

Attachments

  • pr 14 jun.gif
    pr 14 jun.gif
    41.7 KB · Views: 177
Last edited:
@Pacito.
Hope you would like to reconsider your view on page 58 since you currently have one close to the overbought zone. Mind you the “inverse meaning” implicitly is linked to my stop-win. From an analysis point of view the charts offer something interesting.

Clown
I really don't see a page 58 at the moment. I see an almost unbelievable rise in the chart as well as in the RSI. They are walking together as someone with his dog. We almost reached the top of the 4th of June. Its still consistent with my view that the top is set in June. I like to see 550, but with this rollercoasterbehaviour it will be a hard job before a more serious correction takes place. The US seems to be pressing lemons. I hope they will swallow the juice themselves instead of leaving that to us. I don't think we deserve that.
Pacito
 
Vrijdag 15 juni alleen de pareltjes eruit halen geeft meer rust in je donder

Better save than sorry or enjoy the index points you have got and forget about the few ones you have missed. Given the monthly expiration I recall the words someone used for the occasion, expect the unexpected. It took some time and I almost gave in however the AEX did produce one of the GJN relevant signals Thursday afternoon. Well, Pacito, what to say about the page 58 even in the overbought zone it will take a close on Friday in the first hour of trading above 546,87 to get it out of the chart. If that also is below 546,96 you have an other signal in your chart. And the Tuesday price drop was announced by a page 58 that was taken out by the bonus signaling the next day. The rollercoaster behavior you experience is basically the result of page 58 situations and the ultimate result of them being new school signals in both up and down direction. As a guy who likes to pick up some money trading with a calculated conditional risk I have to tell you it tastes like nothing else.

The worrisome chart remains the EOD one and the ADX does not seem to reward a rising AEX. The mentioned threshold in the above posts is where the AEX has arrived so it’s something like a make or brake situation. The upside potential is limited and backed up by a new school signal. So my preferred scenario includes the taking out of the existing page 58 situation as pictured above with the remark that it does not necessarily will have to happen in the first hour of trading (the price level will than be different in that situation). Next would be an other page 58 down and preferably concluded with a new school signal to wrap things up. So I am not putting any money on your June 4th top which was actually the 5th at 547,82, yet.

Needless to mention that these are only the thoughts of a Clown and the actual cold hard evidence will have to be found in your chart as and when it happens. By the way Quick pointed out that Mercury Retrograde is coming and according to our blond vamp there are traders who take a holiday brake during this star event, well she is wrong timing markets anyway. As for the Yanks you have the same chart I am looking at so you would have seen the new school signals with targets > 14000 for the DJIA. And Comstock forgot to deliver the first half hour of DJIA yesterday’s data so what about data quality from your supplier, I wonder if they really expect me to pay the invoice they sent me.

Have fun trading to WIN

EDIT:1
The page 58 has been blown away and the intraday chart has completed the first phase of my ideal roadmap scenario. Next would be a turn given the present landscape that would be a “buying the dip” opportunity providing the signals do not change dramatically and the risk/reward is interesting enough for trading. The very same trailing stop-win that threw me out yesterday today 11-12u has 546,75 as value and the dynamic short term intraday trend changes negative below 541,77 (this level is rising due to the dynamic nature and was considerably lower yesterday so did not use it than as hard exit the distinct difference between analysis and P-trading). However Pacito has made a valid point in respect to the month June and I am going to be extremely careful playing the long side towards the end of this month. Oeps that was your June 5th top just now.

Have a nice weekend.
 

Attachments

  • aaa.jpg
    aaa.jpg
    136.8 KB · Views: 174
Last edited:
today: it's the same old story.........
.....like yesterday....kd = 551-552

@Clown: they didn't throw you out this time i hope ?
(if you won't join them, beat them;))

well Pierre, and what did we got on the boards today ?
...you say 551,91 ? .....well, its not bad for a beginner.....

Thanks and have a good time.
 
Last edited:
what a move

PR on the weekly 551,66 has been met, now what's next

cheers and nice weekend
 
How would you interprete these charts?

Weekend, time to think. The trend is your friend. Maybe time to make a new friend?
Think about the charts, comment them, shoot at them, and publish your thoughts.
Pacito

Albee, yes.
It's nice to see the jumps afterwards to 61,8 then 38,2 then 23,8 to 0.

Your counting A, B, C is the same as mine. Your 1 is about 70 points. 3 is never the shortest, most of the time the longest. When 3 is 70 points that would be over 600 and 5 still to come. Be aware of the fact that we are counting in months here. 6 weeks for 1, about 6 weeks for 2, now 3 has started, let's say double, that's 12 weeks. Then we can reach 600 by the end of August. 6 weeks for 4 and then 5. Somehow it doesn't fit in the Benner-Fibonacci cycle which has a top for 2010. At this pace that top would reach 850. That seems somewhat overdone.
On the other hand, your 2 is sideways so the coming 4th wave should be a diving one that can reach 547,x but not beyond. Interresting but not my favorite counting.
 

Attachments

  • A.jpg
    A.jpg
    331.4 KB · Views: 207
  • B.jpg
    B.jpg
    327.9 KB · Views: 195
  • C.jpg
    C.jpg
    394.3 KB · Views: 205
  • D.jpg
    D.jpg
    337.3 KB · Views: 192
  • E.jpg
    E.jpg
    282.8 KB · Views: 188
  • F.jpg
    F.jpg
    281.2 KB · Views: 192
  • G.jpg
    G.jpg
    304.4 KB · Views: 191
Last edited:
Toppie ??

@ Pacito: that would be a girlfriend in my case..

Serious : your 547 and 557 gives 552 when we take the middle of it. To take the last part we have to clime in the pole of the topflag.
For monday /tuesday is a little short-squeeze still an oppertunity, whitch could bring us to 557-558, but i doubt if this happens when i look at the blow off last friday , and in combi with the yanks, i would be surprised.
But markets do merely surprise us so we can nothing exclude.

my impression is first abit lower and see what happens.

compliments for your charts, mine's are b*lls***.
yours looks like "artistic material".

Edit: fibo 100 = 522.x
0= 541,4 (do you remember 1999-2001)
161,8= 552,8
 

Attachments

  • fibootje 16707.gif
    fibootje 16707.gif
    107.8 KB · Views: 214
Last edited:
sorry for destructing your chart pacito, but is this a possibility ?
 

Attachments

  • pacito.jpg
    pacito.jpg
    160.1 KB · Views: 225
comparison 1999-2000

Is this the similarity between the two?
Pacito
 

Attachments

  • AA.jpg
    AA.jpg
    263.6 KB · Views: 202
  • AB.jpg
    AB.jpg
    275.7 KB · Views: 196
Rsi

Just two examples of the RSI and how it reacts on changes. Notice that the first rise is 100%, as is the second. Exactly the same also. Notice that the RSI doesn't rise as much. So there is a ND. The third rise is 200%, yet the RSI doesn't reach the value of the first one. What can we learn from this phenomenon? What goes up, must come down. To me the ND is a by-product of the PR and the NR. It doesn't tell me how low the price will be, and it doesn't tell me when the price is going down. Afterwards yes, but I can see that at the chart itself.
Pacito

Ps. this is a fake chart, not representing an existing share.
 

Attachments

  • voorbeeld rsi2.JPG
    voorbeeld rsi2.JPG
    61.9 KB · Views: 189
Weekend, time to think. The trend is your friend. Maybe time to make a new friend?
Think about the charts, comment them, shoot at them, and publish your thoughts.
Pacito

Albee, yes.
It's nice to see the jumps afterwards to 61,8 then 38,2 then 23,8 to 0.

Your counting A, B, C is the same as mine. Your 1 is about 70 points. 3 is never the shortest, most of the time the longest. When 3 is 70 points that would be over 600 and 5 still to come. Be aware of the fact that we are counting in months here. 6 weeks for 1, about 6 weeks for 2, now 3 has started, let's say double, that's 12 weeks. Then we can reach 600 by the end of August. 6 weeks for 4 and then 5. Somehow it doesn't fit in the Benner-Fibonacci cycle which has a top for 2010. At this pace that top would reach 850. That seems somewhat overdone.
On the other hand, your 2 is sideways so the coming 4th wave should be a diving one that can reach 547,x but not beyond. Interresting but not my favorite counting.


Pacito, does this mean that your scenario's of 31 May and first of June :)31 July 480-490) are no longer an option?

Thanks, by the way, for developing your ideas here


:cool:
 
option

They are still an option. As you know I had to revise my original view about the bear part by shifting it to three weeks earlier. Maybe the next bear part has to shift also. But for now I still see the top in June (which isn't over yet). And I still expect a downturn with a bottom in July or August.
Pacito

It's far from being TA-related but still the Mercury Retrograde has often been proved to have a negative influence on stockmarkets. See the attachments in this thread of Clown. The retrograde has started the 15th of June and can be influential untill the 10th
of July. So, who knows...
 
Last edited:
Here is my picture. Friday all down targets where blown away, so I don't know where it will go. Only the old PR of about 560 is still in the daily chart. I tried to put some fibo levels with a wave count in the daily chart, but somehow it does not fit. I am back to the old idea of 575, but I will not put any money on it. As a matter of fact maybe I will skip the summer and be back in september. In a few weeks the kids will have their holiday, so I will be on the beach when the sun is shining.
 

Attachments

  • aex20070615.gif
    aex20070615.gif
    40.5 KB · Views: 178
Huh?!

It's far from being TA-related but still the Mercury Retrograde has often been proved to have a negative influence on stockmarkets. See the attachments in this thread of Clown. The retrograde has started the 15th of June and can be influential untill the 10th
of July. So, who knows...


Jane please tell me Tarzan where you have read that Mercury Retrograde is Bear.

A planet in Retrograde travels, seen from the earth, the opposite direction as opposed to it’s normal direction. The Greek in the early day’s of our world already noticed this and used it in their science to support their agriculture. Later astronomy research like Bayer also is primarily on typical agriculture challenges like harvests even the early last century approach to the Dow Jones index has such an angle. When a planet is in Retrograde it would correspond with it’s related issues to act not as usual. The Mercury related issues are communication, travel and education in the broadest sense like television, newspapers, airlines, mail etc. The blond vamp who translates a US astrology weekly and tells us that according to that individuals view, when Mercury is Retrograde the Technical Analysis does not work like it usually does and that there even are traders who plan their holiday when Mercury is Retrograde.

It is not so much the Retrograde phase it’s more the Mercury aspects that display rumors in the press so today that would be the Internet as a medium as well, which potentially results in stockmarket moves. However things are not quite that simple since there are a number of other planets in the universe that are having some effect as well. So far it is a bit too much Astrology for me as opposed to the more mathematical Astronomy that does appeal more to me because it can be simply checked in the index data file.

Attached you find an AEX data chart with Mercury Retrograde period highlighted so you can see yourself if the bears are dominating this event.
 

Attachments

  • aaa.jpg
    aaa.jpg
    208.9 KB · Views: 210
Top