Clown's 2007 outlook is work in progress

Week 21.

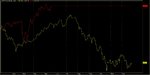
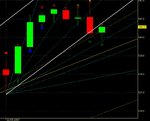
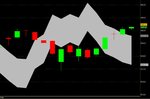
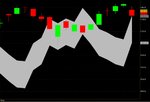
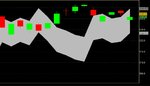
It has to be mentioned once again that not all the used techniques can be discussed each and every week in detail so you will have to combine the information from a number of different weeks. The backbone is the 2007 outlook so let’s look at the January 6 worksheet and put the year to date AEX into it (red line is AEX year to date, yellow is the 2007 projection worksheet). The origin of the worksheet data is in fact the DJIA so it’s not as much the exact price but more the rhythm that is of relevance. The rhythm of an index is not influenced by the content of the index itself only the price fluctuates within a tolerance level. Well it is in fact work in progress and I identified several area’s for improvement after all it’s not something which is immediately clear.

Rest assured I am not getting ahead of myself the cold hard indicator signaling remains the primary foundation for the trading decisions. The scenery in which those decisions will have to be made are interesting and help to improve for instance the Elliott Wave Analysis. If you recall the 409,56 fits best as fifth wave within the 217,80 pattern and I keep an alternative open that the high to come turns into the third wave. Similar thoughts will have to be made about the 409,56 sub-labeling which directly implicates the difference between the best scoring year to date pattern and the pattern that’s going to pop-up at the finish. Without getting into the merits of the many different patterns just look at your chart and consider 409,56 to 512,47 the first wave and 512,47 to 469,85 the second wave at least you notice the difference in elapsed time.

The 469,85 pattern best scoring scenario has a fifth wave up starting at 521,10. Within this wave the best scoring scenario is a WXYc pattern which has scored it’s first target at 535,30 and second at 538,38 almost (detail) when compared to the ideal pattern the third wave is running a bit too long. For next weeks trading roadmap we are going to start with the 525,65 pivot to keep all options open. Needless to add that there are a number of alternative wave counts left that might end up as a winner the best scoring scenario is static but can however be used for the outlines in the trading roadmap for this week. Depending on the actual price/time performance from 538,29 (probably Monday) one of the more complex corrective patterns that has five waves will come forward. The new school and additional indicators complete the picture for the P-trades.

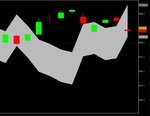
It has been a while I have included the KVKD trending area systems so let’s look at two of them since they might help us this week. The 307,31 (!!!) weekly trending area indicated a relatively value which made me close my MLT positions some time ago, the value is still relatively high and indicates limited price rise with a Derivative Oscillator coming of it’s high value moving down. The 470,54 EOD trending area system is playing a role again with the threshold around 540 that kept back the AEX last week. If you consider the indicator remarks throughout the day it is best described like the price\time matrix needing to built up enough potential to knockdown the threshold, fair enough resistance. The 521,10 hourly trending area together with the Derivative Oscillator is going to help indicate if the price\time matrix charged adequately. To give you a rough idea, Monday morning the support area is around 535 and in that area the level of price correction should be made clear.

The main Astronomy for the stock-market objection has always been found in the Bradley indicator that never could tell the difference between a high and a low. The mentioned dates always included the plus and minus 1 to 3 day’s for something that might be a top or a bottom with a huge failure rate. The thought to be able to cover the factor time in a totally different way which is completely independent from the other variables (price and volume) is something so appealing that I continue the evolution tour. My first attempt, the Clowndicator, identifies timeslots using a layered structure generating harmonics where price tops might be expected and June has such a value although it must be mentioned that the major level is not included. So a June high does not relate to the longer timeframes like for instance the December2006\January 2007 value. The recent angle identifies both high and low also at different layers and the bear influence in May was spot on. Using this encouragement to do some further developing and testing in the analysis set-up into multiple layers linked to cycles or waves which are targeted to assists in trading for future time and direction.

Since volume popped up and Pacito mentioned it last week, I reviewed my own efforts and had to conclude I made just one serious volume effort and that is the MFI indicator. When I think about the Gann volume remarks I don’t come up with much more than that volume rises at relevant turning points. When volume represents the actual number of trades than what about the two involved parties, more specific their thoughts about the market direction. Even the question if the published volume does in fact represent the actual trading done is not as simple as it might seem. So basically I have not yet found the sound arguments to drop everything I am working on and start working full blown on volume.

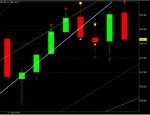
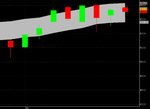
From a trending point of view the weeks chart is positively trending between 527,70 and 541,11 in the projected trend chart. The daily version just entered the next slice between 529,30 and 542,72 last Friday. One of the other less known Wilder indicators the ADX is a reference for the strength of the trend. The daily chart shows a decline in the ADX whereas the AEX price rises and even though the DMI cross and valid buy signaling it has to be confirmed by a rising ADX soon.

Have fun trading to WIN.
 

Attachments

  • aaa.jpg
    aaa.jpg
    184.5 KB · Views: 191
Petje af

Hello Clown,

Good story and feeling of the AEX! Well done...

I try to contribute in this thread.
The daily der. osc. is still in negative territory and the hourly ended negative. In my opinion there are several scenario's but I think there are two most likely one's:
First, the osc's. become positive again and the AEX moves to the north to its PR. Or second, the osc's. moves south and we have an extended flat....... We will come to the montly energy at 507

Success,

Blinker
 

Attachments

  • energie 1.gif
    energie 1.gif
    77.7 KB · Views: 182
Dinsdag 22 mei

The devil is in the detail, and what a detail it was right after Monday mornings opening. The reaction was insufficient for the price/time matrix to built enough potential to realize a new multiple high and the building process started again. The first relevant support level is slightly higher than it was at the Monday opening. More important is the Technical Analysis New School signal targets that needs to fit in the price\time matrix and this process is currently active. It has to be noticed that the price/time matrix is in need for additional potential to get those targets in.

Have fun trading to WIN.

EDIT:1
What can I say, well fun it definitely is. The first line (dotted yellow in the attachment) is roughly the 23,6 retracement level and that is not such a extraordinary level for a fourth wave. The complex corrective patterns allow some more so I keep an extremely tight stop-win. If you throw some of the re-engineering angles at the favorite indicator, combine it with the legendary page 58 and the existing New School targets the picture is becoming clear.

EDIT:2
The festivity of Technical Analysis New School recognition is once again complete and the number one facilitator of today’s P-trades. Well your present has been delivered now you need to maneuver with some care and watch a number of mixed signaling. Close to perfection would be the creation of the next present fitting within the active new school signaling so I am playing with the reduce and accumulate buttons. Not without a smile one might watch a debate about the add-on value of Technical Analysis in trading simply because it is not a discussion as suggested. Last but not least one is missing the point completely.

EDIT:3
Especially for the ones who cherish the GJN broadening formation view one of the flavors that fits best the actual price chart. The implicit message here is that there are many different chart patterns that meet the overall general description GJN provided. The attached description of one of them is consistent with the above Technical Analysis New School signaling. Trust I am not violating any publishing rights by just showing a few lines and consider it more like an advertisement for Bulkowski’s book Encyclopedia of Chart patterns. (if not well, see you in court Dutch ones I like best. LOL)
 

Attachments

  • aaa.jpg
    aaa.jpg
    197.2 KB · Views: 179
  • aaa1.jpg
    aaa1.jpg
    167.4 KB · Views: 176
Last edited:
Woensdag 23 mei.

It has been a while since we had seen a multiple year high in the AEX so the crash story’s were popping up again. The high and low values in the stock-market are relative values and when someone concludes from a relatively high value that the only way is down he or she is in for some surprises. Objective signaling is the answer to the challenge and provides the clues to do the P-trades.

Given our trend we are looking for the support that will provide us with both turn and present to do the trick once again. Even when the signal has not yet entered the charts it is anticipated that it does not meet the active signaling target.

Have fun trading to WIN.

@Blinker
Luck has got nothing to do with trading!!! Let the SUN shine.
The trend modus of operandi allows you to use Support and Resistance differently when combined with qualifying and quantifying the level of that trend you can use the resistance as reduce and the support as accumulate (when in upwards direction). At the relevant pivot I enter my trade say 10 contracts , when the S/R level is hit and my indicators tell me it has been enough but still within the trend phase I reduce to 5 contracts, the next S/R level in combination with my indicators telling me the price/time matrix has been reloaded I accumulate to 15 contracts, etc. Mind you should be monitoring when your trend enters the next phase to alter your trading position.

EDIT:1
In the first attached chart you should be aware that there are S\R levels from three different levels which are in sync with the applicable Elliott Wave count. The devil isn’t always in the detail as this morning your present missed it’s target by 0,18 index point. As my favorite trading adagium is: “a trader is as good as his NEXT trade” we are going to look for the support level which will qualify for the accumulate status. And to complete the picture it must be mentioned that a new situation with the appropriate reconsider is a distinct possibility at the last dotted blue line in the attached chart.

EDIT:2
No Sir, I am not forgetting about trading when wondering about the economy issues. The AEX arrived at the yellow line and did that by the definitions on page 58 including the bonus new school signal. However it’s not enough and my star based indicator which is a completely independent indicator warns me to be careful so my stop-win is tight and I will not hesitate to execute. The reason I did enter is that there is no economic data release that might mess with my trade at 14:30u.
 

Attachments

  • aaa.jpg
    aaa.jpg
    268.1 KB · Views: 166
Last edited:
Volop zon vandaag

Dear Clown,

Because of your attachment yesterday I've looked in the charts for some evidence. Well, just take a look in hystory and see what happens today....... It's all in how? to draw the lines. Luckely Brown told us how....

Last attachment is the support and resistance given yesterday. We started in the support zone, moved to the north, came into the daily resistance. There it stopped and we pulled back. I know, support is what we are looking for but it's nice to know were we can find resistance so we can close our longs and buy back at a lower level.
Wach the der. osc. and the white dots..........

Good luck today, don't forget to buy at the support
 

Attachments

  • energie 2.gif
    energie 2.gif
    55.4 KB · Views: 160
  • Broad form 3.gif
    Broad form 3.gif
    31.5 KB · Views: 152
  • Broad form 2.gif
    Broad form 2.gif
    36.6 KB · Views: 169
  • Broad form 1.gif
    Broad form 1.gif
    36.1 KB · Views: 158
We have a lot of indicators to choose from. The draw back of most indicators is that they come from the same source: price, volume, time. What we need are indicators that come from different sources. If you have a reliable indicator on price and time, for instance the RSI, Stochastics, MACD or DMI, it's not necessary to use them all, because the source they come from is the same. What you need is an indicator from another source, or at least partly from another source.
All, not most, indicators are derived from time, price and volume. Various ways of chopping it all up and splicing it all together again, but in essence, it's a combination of one or more of those technical elements which host the exponentially increasing panoply of indicators available to technical analysts.

You're absolutely right to be asking; what else and from where else.

Confirmation of bias and trend and direction and momentum in one market cannot reasonably be expected to be sustained from any subset from that same universe of instruments.

Intermarket analysis may go some way to answering your question. Not only does intermarket analysis provide multiple-source support and confirmation, and as importantly, when it doesn't, it also can provide in statistically significant measure useful lead times in trend changes.

For instance, the relationship between commodities, bonds and stocks. Commodities, using any major index and CRB ain’t too bad, are generally correlated with interest rates and bond yields and inversely correlated with bond prices and stocks. Interesting enough from a confirmation perspective and especially so when they don’t correlate in this manner. What is perhaps more interesting is the lead time provided by this analysis. Not as much use for the shorter timeframe traders, but when you have a 92% probability of a 4 month lead time that is extremely usable data.

Not enough is done in my view to highlight the significant benefits derived from a study of intermarket analysis.
 
kennen wij u onder de naam B..

Interesting view The Degrees,

You might want to try and get a hold of the cycle work done by two Merrill Lynch analysts called Trevor Greetman and Michael Hartnett. They analyze markets by two indicators: 1) economic growth and 2) inflation. Personally I feel their cycle weak spot is the qualification and quantification of their indicators (something to do with “lagging”) but hence I am in for some education.

If you introduce inter market relationships well we have an other challenge since the above cycle probably would implicate we are in the phase between highest economic growth and highest inflation. This would be the US and the EU is displaying something else so we are back to the geographic spread (?) once again. An other observation has got to do with their preferred investment type which in the above situation (between highest economic growth and highest inflation) is a savings account. With stock markets scoring multiple year highs and even all time highs that seems a bit odd to me. Well the two Analysts allow exceptions where one or more of the phases might be skipped which they found in historical data happening 5 out of 24 times, a 21% failure rate.

The relationship between bonds , interest rate and the correlation or even failure to correlate has been spread over us by the flock warning us the crash was coming. Your statistics, if at all correct, do not relate to trading since someone strikes bankruptcy within your 4 months timeframe too swiftly. Personally I like putting my brain at work however in trading I stick to the trades to WIN.

Have FUN trading to WIN.
 
Kruisingen

In december I showed you a chart with several crossings. We are now some 5 months further in time and I want to give you a glimp of that 'old' chart. Curious what will happen the 12th of June!

Tomorrow is my daughter's birthday. Cheers!

Blinker
 

Attachments

  • Kruisingen.gif
    Kruisingen.gif
    49.3 KB · Views: 155
Last edited:
In december I showed you a chart with several crossings. We are now some 5 months further in time and I want to give you a glimp of that 'old' chart. Curious what will happen the 12th of June!

Tomorrow is my daughter's birthday. Cheers!

Blinker

have a nice day and thanks for your nice charts.

:p
 
Donderdag 24 mei

The Technical Analysis New School provided you two presents the first underscored by 0,18 index point the second overscored by 0,01 index point and the signals which are a bit longer in the charts remain active. Looking at the above present signaling the spread is identical the amplitude is definitely smaller in the second one. The target of the still active signal might however be a bridge too far in this run and additional signaling could be required. Also notice the ND line in the intraday RSI chart which kept the AEX from moving further upwards yesterday.

The DJIA chart has got an active New School signal as well and it has got an additional one in the intraday chart so we are in sync if you like although at this stage I would put my money on an extra swing in between. So let’s look at the projected trend fractal in the EOD chart for some outline indications.

Have fun trading to WIN.

EDIT:1
Just to show you how dynamic the projected trend fractal is I updated the first chart with today’s data, please bare in mind the EOD chart uses the intraday value. This afternoon we will receive some economic data causing action/reaction and when fitting within our set-up well fun it is.
 

Attachments

  • aaa.jpg
    aaa.jpg
    150.9 KB · Views: 172
  • aaa1.jpg
    aaa1.jpg
    126.9 KB · Views: 180
Last edited:
draaien en keren

This morning we broke the red TDtrendline, which gives a target around 532.
 

Attachments

  • aex20070523.gif
    aex20070523.gif
    34.8 KB · Views: 191
The relationship between bonds , interest rate and the correlation or even failure to correlate has been spread over us by the flock warning us the crash was coming. Your statistics, if at all correct, do not relate to trading since someone strikes bankruptcy within your 4 months timeframe too swiftly. Personally I like putting my brain at work however in trading I stick to the trades to WIN.
Thanks for the recommendation on the two ML analysts, but they sound a little fundamental for my tastes.

Addressing your point which I quote above, I agree 4 months is more than ample time to lose everything. I have managed to do so in far less time so should award myself some sort of medal I imagine. But if there is an approximate 4 month lead time from commodities on bonds - which I have satisfied myself there is - and if you factor that potential bias into your other trade construction criteria, it can only in my view be a good thing. Confirmation and indications from 'other sources' which was Pacito's original enquiry.

Having a recognisable top in commodities for instance - which having 4 months to present itself gives ample opportunity to clearly identify and confirm itself to any trading community that cares to look for it - provides us the opportunity to anticipate with reasonably high probability (92%), an upturn in Bond prices (downturn in Bond yield) and upturn in Stocks etc.

It is equally useful when no such trend change occurs in the other markets after such a top in commodities as a signal of a potential major inversion/perturbation of some type and as a signal to tread very warily and with a cautiously fore-shortened timeframe.
 
Vrijdag 25 mei

It’s somewhat impossible to figure how much I can aspect you are aware of the Brown stuff so I just throw some at you and see who picks up what. Thursday morning the observation was made a page 58 situation might be applicable and yes Sir you were completely right including the Technical Analysis New School Bonus signaling. However something called ABC or UPG could not be dismissed without proper ruling and well what can I say there actually is such a pattern on your screen. So you want to know what next.

You should be able to make an oberservation that has to do with the New School signaling and that’s the exit or the word I hate so much since I focus on P-trades, Stop-loss. I don’t’ want to be a pain in the better part of your body but check your book and focus on the exit bit. Then look at your chart and wonder how extremely beautiful the world in fact is.

From a S\R point of view we broke the support level Thursday morning right after opening and tested the same level now functioning as Resistance in the afternoon. The next support level is the more critical one because if it does not function as support we are in for some more down movement. The next support level depending on the actual time is in the 534 area and if you care to have a look at the retracement levels you notice that the 50% level is there so keep an open mind to the 61,8% level as well.

Attached the EOD projected trend fractal chart showing the boundaries of the level below the present one.

Have fun trading to WIN.

EDIT:1
Well the festivity of Technical Analysis recognition once again is complete although I realize not everyone is up to speed. The AEX opened just below the critical support area and is currently testing the inverted function now being Resistance for what it is worth. The indicators show that even tough not impossible it is not very likely short term so we need some additional time catching on to the involved levels.

EDIT:2
The Heineken commercial is nagging my mind all morning, “ Now we wait”. The AEX seems to hold on to the resistance levels with chewing gum, the attempt to have a go at the levels failed right in between the two. The move sideways is lowering extremely slowly the strength of the down trend and momentarily busy to conquer one of this trends resistance levels. During this phase the risk of a downtick remains a distinct possibility although the potential in price of this down swing is getting smaller.

EDIT:3
Slowly however steady the level of downtrend is being taken down and the AEX had a brief second visit in between the two resistance levels. The trend line downwards has been passed and is being tested as support as opposed to it’s previous resistance function. It has to be mentioned that the two broken critical support lines still function as resistance. And it may sound a bit out of the box but the potential down spike when conditioned (if when and or) properly will be ending up as a strong buy signal. If I am correct there is going to be some economic data release, so you know the drill.
 

Attachments

  • aaa.jpg
    aaa.jpg
    143.7 KB · Views: 209
Last edited:
zo maar wat hersenspinsels

Good evening, we've had all the festivity behind our back. I feel overfed.

Just opened the TA-module. It was also a festivity of reconicon (hard word). The first picture was showen to you a copple of days ago. Needs no words.

Second is an other tabblad on the desktop. Need I say more?

Third needs a bit more words. Here you can see the weekly aex with montly S/R. Middle is the daily combined with weekly S/R. And - you guessed right - hour comb. with daily.

If the aex opens the same it closed today, we are at the end of daily resistance. The daily energy is at 537.70 That's also weekly support. This all combined with a higher Waal straat, a reversalday and a vib. which is above n.a.p. (and a bit of other stuff) it's lickely we move north.

No garanties of course, Bush has have had $100.000.000.000 to go to war. I think he will. All his savings are invested in the wapensindustry. "I will make you rich" Son of a......!

Prettige pinksterdagen en tot dinsdag,

Blinker
 

Attachments

  • energie 3.gif
    energie 3.gif
    40.2 KB · Views: 166
  • aex 2.gif
    aex 2.gif
    18.9 KB · Views: 153
  • aex 1.gif
    aex 1.gif
    11.8 KB · Views: 159
Last edited:
Week 22,

One thing about computers and the involved technology I have always liked best and that is the simplicity of it in the purest form. If you look at the essence of things it comes down to one single digit or switch with status 0 or 1 that’s all there is to it nothing more nothing less. The complexity is created by the huge number of switches or digits used so one gets lost easily. In order to survive in this environment I had to break down the complexity into straight forward yes/no situations and you immediately see the resemblances in analyzing and trading the stock-market. A trend is either positive or negative and forget about the guru’s who want to let you believe markets are 80% of the time trading (in a vague range definition) and only 20% of the time trending. Basically they lack the ability to brake down 80% which is your opportunity the improve analysis and trading dramatically.

The Elliott Wave Analysis in its merits is a fractal way of looking at both price and time and enables you to brake down a market in trend levels with the bonus of qualifying and quantifying those trend levels. It is not perfect, but what is, so you will be needing add-on’s to improve your trading roadmap. This weeks trading roadmap I will be using the 525,65 pivot to start with and move it up to the 531,65 when the third wave has been confirmed. I will not bother you with wave counts and patterns just look at your chart for higher lows and highs. Yes Sir, you are right this pattern of higher lows and highs just can’t continue for ever and we are entering a phase to be alert but enjoy it while it lasts and make some money.

Last weeks AEX price movements reshuffled my setting a bit since the 531,65 is a value outside the roadmap scope even though the swing was anticipated Friday morning before opening. A new hourly KVKD 542,07 trending area system moving down will guard the downside risk and indicate when we are out of the woods. The reading capabilities provided by the Technical Analysis New School initiated the present trading positions.

The attachment shows the projected trending fractal of the Weekly chart because it shows the threshold keeping the AEX from moving up at the same pace we have grown to get used to. Due to the Pinkster weekend I keep it short and will not be online much first half of the week.

Have fun trading to WIN.
 

Attachments

  • aaa.jpg
    aaa.jpg
    135 KB · Views: 155
Woensdag 30 mei.

The charts contain both positive and negative New School signals so you probably wonder which ones you should consider and which ones you should forget. Well there is no simple answer and basically you should never neglect any signal, just the way you incorporate it within the whole picture differs. The festivity of Technical Analysis recognition is once again complete as one of the new school targets has been met. So we are at a point where decisions are being made and if you cross both old and new school Technical Analysis you found something interesting in your intraday chart.

The EOD chart has arrived at a critical support area and will have to deliver or else the downside risk is substantial. You might want to consult the ADX in the same chart.

Have fun trading to WIN.
 

Attachments

  • aaa.jpg
    aaa.jpg
    123.6 KB · Views: 156
Donderdag 31 mei.

Well an interesting situation it definitely was Wednesday morning and the reward for investing time and effort in understanding some of the merits of Technical Analysis brought an other P-trade. When placed within the short term picture it should be mentioned that we are not out of the woods yet and the more complex corrective Elliott wave pattern remains a valid option. This corrective wave would main an other turn down at the a) 536,73 or b) 538,42 price level. So watch the page 58 definition to monitor the alternative and if you don’t understand you still can blame China for the Wednesday drop like the ignorant guru’s who haven’t got a clue. Needless to add that when above those two levels the corrective wave down has been completed and targets >540 are due.

In the EOD chart the support that functioned successfully in the projected range fractal trend and now looking to enter the next one above it.

Have fun trading to WIN.

EDIT:1
As suggested to keep focus this morning you are aware if disproportional movement is momentarily applicable so you will be able to place the next move into perspective. The trending modus should complete your picture. This is the part where you will know how much you actually know and understand about the Technical Analysis New School merits.


From an Elliott Wave Analysis point of view starting at the 531,31 pivot the present best scoring scenario has a wave 3 on the high this morning and a wave 4 down most likely still in process. This would be in sync with cooling down my trading indicators. From a responsible trading point of view this is no entry since the risk/reward value is unfavorable unless of course you are more the gambler type of trader.

EDIT:2
Let’s do a quiz maybe it might even stir up things a bit here since it has been awfully silent so: two important TA events happened today influencing the near future in your trading. Do we need a winners price? If we do well if you are interested you can receive an invite to the TA software user meeting (next week Wednesday evening right in the center of the Netherlands) the same software GJN was using for his daily column. Maybe even Cold or Warm is willingly to allow a second winner to go. (LOL)


Cheers
 

Attachments

  • aaa.jpg
    aaa.jpg
    125.2 KB · Views: 146
Last edited:
Top