You are using an out of date browser. It may not display this or other websites correctly.
You should upgrade or use an alternative browser.
You should upgrade or use an alternative browser.
Clown's 2007 outlook is work in progress
- Thread starter The Dutch Clown
- Start date
- Watchers 26
The Dutch Clown
Established member
- Messages
- 592
- Likes
- 11
een Pietje hier een Pietje daar.....
Much has been said about the value of Technical Analysis and the most made mistakes are identifying the technique with an individual without realizing the merits of analyzing. There are many different techniques available and an analyst can use those to support both up and down directions from the very same starting point. If you use a form of Technical Analysis make sure you have your input data correct, the formula’s you use checked and double checked, you know those formula’s inside out and you read of the results correctly. Your conclusion will have to be based on the mere facts and nothing more or less.
If you let this sink in for a while you now know that loosely coupled remarks about movements, direction or index values are like firing blanks and only disturb.
Well albee, today’s 554,62-Pietje has delivered a new one at 552,20. The dynamic trend in the EOD chart is going to play a decisive role this week in the overall picture with a threshold value 555,74 today.
Cheers.
dear Albee,
In your picture you mention a KD-pietje of 557. Can you explain how you calculate this value. I think you use the "hoogtelijn" out of the top corner to construct a price (in this case 549,5). In my attachment I have drawn some lines and if the price reaches the topcorner, the KD will be 555,5.
regards
EDIT long pos closed
Attachments
Last edited:
The Dutch Clown
Established member
- Messages
- 592
- Likes
- 11
heb je last van pietjes jochie?
The most recent 552,20-Pietje is playing its role and within the overall picture the EOD chart threshold is at 555,64 on Thursday. Much has been said about trending methodologies and many different flavors are available. The ones I like best are dynamical which means they adapt to the underlying value and when dividing them into fractals it really becomes thrilling.
That was my recap yesterday evening now the 552,20-Pietje passed away and we have a new one called 555,63-Pietje. Rentenier, for more information on the Pietjes you will have to read the information in the Friday thread on IEX.
Have fun trading to WIN.
EDIT:1
Today’s two Pietjes (555,63 and 551,23) are meeting at approximately 14u so one might expect a decision in that area. A bit further down the road the EOD dynamic trending chart is the most relevant one to keep focused on.
Last edited:
The Dutch Clown
Established member
- Messages
- 592
- Likes
- 11
't benne en blijve leuke dinge veur de mense
Learning Technical Analysis what ever technique or school is a process and should be approached as such. So take it step by step and make sure you feel comfortable with the present step before you move on to the next. A taken and confirmed step is also a comfortable way back since each and every next one will generate confusion as well so if that confusion is dominant just take the previous step to withdrawn and reinforce. Mind you the confusion will only grow once to take more steps in the process, I don’t want to scare you off just want to let you know it’s part of the deal and don’t let the confusion scare you, move back a step and built up your comfort level before re-entering the next level again. Each and every new level brings more options to the table and you will just need some time to fit those into the previous required knowledge.
The 555,63-Pietje remains to be active and the chart reveals a series of lower lows and lower highs. The 551,23-Pietje was taken out and mind you just look at the 14u bar the crossing of the two, a successful testing for it’s resistance value would be appreciated as a first signal and intraday entry signal. The overall picture a bit further down the road continues to trend negatively with Friday’s breakpoint at 557,87.
From the Technical Analysis new school department you will find quite a few signals in your charts available and the mix of both Positive and Negative Reversals does not make it a walk in the park I presume. However keep your eye on the ball and let nothing disturb you when in doubt stay out and think of it like better missed money than lost money. Take the next one you feel more comfortable with do not over-trade.
Have fun trading to WIN.
@nootje
The Reversal calculation has to be done according to the strict ruling described in the book and that’s absolutely not random. Look at your hourly chart this morning 9u and look at the GJN post timestamp this morning if you wonder if there is something like a coincidence,?! Now have a look at the Astro attachment a couple of posts above in this thread. However I suppose it might look a bit odd since the two previous PR’s in this swing were exited, well that’s where the trending modus and Pietjes (lol) come in.
@Rentenier
If you are referring to the 555,63-Pietje you are correct although one of the assistant-Pietjes is currently holding the AEX back. This morning the 549,92-Pietje provided an entry signal and the extension the stop-win, the technical analysis new school provided the price target and the astro analysis provided a time target. The overall picture remains unchanged and awaiting for the next train.
Last edited:
@Rentenier.
target 557 can be calculated with the GJN methode, you can read in the iex magazine.
i use pietje as a kind of mirror(klap en flap).
its tricky when the chart not is in the right position,than you can get a "wrong" output and as mentioned by TDC, the data of protrader is NOT always correct, so keep in mind that the output can be wrong or at least incorrect.
- in the 'dayly' we can see ND.
- for me that means: be alert(no more,no less).
and thanks for your answer, its a pleasure for me to read your reactions on this forum.
Attachments
even wat ophelderen
Just as a small question, as this has been buggin me for the last couple of days..
The ND's and the PR's , are they supposed to be calculated from random bottoms in a trend?
From the charts shown on the other forum and from the last one made by albee I'm seeing people drawing those lines from halfway in a trend, just seems to me that i'd try and put them at the somewhat larger bottoms or tops .....
weer een pietje overleden?
If I am correct another pietje is gone. That same pietje was also a intraday TDtrendline, so a target can be calculated (557 again), but look at the green pietje.
EDIT: I think I found the "hulppietje" (blue line).Also updated the green pietje, it was a bit to steep, optimistic as I am. It looks like we just had a pullback to the red pietje and now the go.
EDIT2: The green piet didn't survive after a strong fight, but the picture remains positive. A higher bottom did make a head-shoulder formation. The neckline is already broken, with a target about 559.
Attachments
Last edited:
right or wrong
wise words:
If you let this sink in for a while you now know that loosely coupled remarks about movements, direction or index values are like firing blanks and only disturb.
--------------------------------------------------------------------------
reaction albee @ TDC:
Thanks, it was a very small correction i referred to and had no intention to scare anyone, but in my enthusiasm of recognising TA-things, its me who did forget the impact of some 'loosely coupled remarks'.
@Nootje: what is your defeniton of 'random'?
- for me it matters which timeframe we are looking at and i am testing some different timeframes.
There must be a correlation between time and price, and as we all know, timing is one of the important things we can use (for P trades), so i'll try to understand this correlation, whit the help of RSI.
By publicating this experiments we all can see whats 'right' and whats 'wrong'. Sofar i am still amazed and reading your reactions gives me much pleasure and fun too.
Lets play the game: target 564...
-remark that i am not a daytrader, but more looking for the 'swings', so in the meantime we also can see lower prices between let say monday and september.
-- for daytrading and other opinions i have to refer you to our tradingfrind TDC, while he is my source of inspration.
Disclaimer: all things publicated here are only for education, certainly not for a tradingadvice.
P.S. i am looking for 'powermesuring tools' , so i can read the power of ups and downs.
-if you know something, we're gone be frinds... greenline gets purple by seeing this bluff(lol)
regards,
Attachments
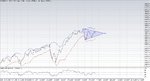
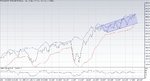
A rooster, a ?, and 4 chickens
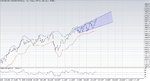
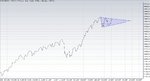
One broadening, one in a channel, and four narrowing triangles. The broadening is worrysome, the channel stays the channel and the four triangles are continuing patterns.
So, what will bring some roaring in the hennhouse. There's no fox in the neighbourhood. But maybe the ever superstitious traders don't like friday the thirteenth.
Pacito
Attachments
The Dutch Clown
Established member
- Messages
- 592
- Likes
- 11
Wassen en watergolven
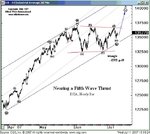
As per request I drop a few lines on Elliott Waves the overall picture. For quite some time the 409,56 has the wave number five when you start counting at 217,80 and this is primarily the reason a number of people who use some level of Elliott Analysis are trying to cause panic by hitting the alarm bells and mention crash with references to 1987 and even 1929. Their assumption is that the fifth wave has been completed but the market which is always right, is telling you something else. The one thing I have consequently learned is that those long term views are often wrong and way of, however from a describers point of view it will probably sell quite well. Any form of analysis used for trading has a level of tolerance and you just use a system on short and medium time periods to start with. Even if you realize the same level of tolerance you have on the short term the long term has higher numbers in both time and price so in absolute value your tolerance has grown dramatically and that what’s directly linked towards your trading result. So let’s take it top down.
The best scoring pattern from 217,80 upwards is called TripleZigZagC and I will have to admit that’s one, if it will end up being the pattern at the end of the line, which is causing some headaches. People who have read my posts last year will remember the pattern when looking out for the third wave. Since it has not come to the end yet we only take notice of the next price and time objective possibilities for now which are 630 and first quarter 2008. So let’s have a look at that fifth wave itself starting at 409,56 as stock markets and indices still fail to move in a straight line we need to adapt.
The best scoring pattern starting at 409,56 is called DoubleZigZagC and has wave W on 512,47 and wave X on 469,85 so currently we have wave Y starting at 469,85. The first pattern hit is found at 557 roughly next week (28), basically the higher the AEX moves up the earlier the time target will be hit. Needles to mention the next hit is further down the road in both price and time. At this point I just have to point to the Technical Analysis New School Signaling and the Astro chart for this period since a number of different techniques provided pieces of the trading puzzle, summarized in post 385 above.
The next level is 469,85 and the best scoring pattern here is called ImpulseC however this one is running quite a bit late (the fifth wave from 521,1 is running too long) and should be denoted. However when the above one will hit things will look differently when looking back at it. In my view these are the area’s the Elliott Wave Analysis should be used with some flexibility and my own solution is to skip the huge number of alternatives to the back of my mind for later use and focus on the last relevant pivot which is 538,74. Which not so surprisingly was part of my last weeks trading roadmap. The combination of different techniques available should be used to generate a trading roadmap since I have not yet seen a technique which delivers them all with an acceptable failure rate.
Within the 538,74 pattern you find the 549,92 and you should have noticed the signaling in that area last week. This trading week is about wrapping this up and looking closely to the price and time place the next train will take you. Don’t worry if you are missing one just take the next one as suggested one step at a time.
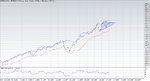
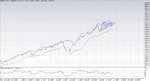
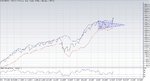
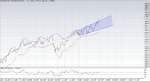
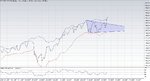
This weekend I had some time to study a bit and since the crash story’s are so popular lately I would like to add my version of F.U.D. (for people not familiar with the IBM sales strategies; Fear Uncertainty Doubt). I have attached two charts with some straight forward Astro basics stuff (okay fair enough, I did something additional work on them) the first chart is the year 1987 (lol) and the second one is 2007. And while I am at it the third attachment is the update 2007 projection worksheet, red is the actual AEX until last Friday’s close and the yellow is the one we started with in January. No Sir it’s not my intention to scare you just keep in mind the AEX is not going to move to the 1000 (just a number) in a single straight line.
Have fun trading to WIN.
As per request I drop a few lines on Elliott Waves the overall picture. For quite some time the 409,56 has the wave number five when you start counting at 217,80 and this is primarily the reason a number of people who use some level of Elliott Analysis are trying to cause panic by hitting the alarm bells and mention crash with references to 1987 and even 1929. Their assumption is that the fifth wave has been completed but the market which is always right, is telling you something else. The one thing I have consequently learned is that those long term views are often wrong and way of, however from a describers point of view it will probably sell quite well. Any form of analysis used for trading has a level of tolerance and you just use a system on short and medium time periods to start with. Even if you realize the same level of tolerance you have on the short term the long term has higher numbers in both time and price so in absolute value your tolerance has grown dramatically and that what’s directly linked towards your trading result. So let’s take it top down.
The best scoring pattern from 217,80 upwards is called TripleZigZagC and I will have to admit that’s one, if it will end up being the pattern at the end of the line, which is causing some headaches. People who have read my posts last year will remember the pattern when looking out for the third wave. Since it has not come to the end yet we only take notice of the next price and time objective possibilities for now which are 630 and first quarter 2008. So let’s have a look at that fifth wave itself starting at 409,56 as stock markets and indices still fail to move in a straight line we need to adapt.
The best scoring pattern starting at 409,56 is called DoubleZigZagC and has wave W on 512,47 and wave X on 469,85 so currently we have wave Y starting at 469,85. The first pattern hit is found at 557 roughly next week (28), basically the higher the AEX moves up the earlier the time target will be hit. Needles to mention the next hit is further down the road in both price and time. At this point I just have to point to the Technical Analysis New School Signaling and the Astro chart for this period since a number of different techniques provided pieces of the trading puzzle, summarized in post 385 above.
The next level is 469,85 and the best scoring pattern here is called ImpulseC however this one is running quite a bit late (the fifth wave from 521,1 is running too long) and should be denoted. However when the above one will hit things will look differently when looking back at it. In my view these are the area’s the Elliott Wave Analysis should be used with some flexibility and my own solution is to skip the huge number of alternatives to the back of my mind for later use and focus on the last relevant pivot which is 538,74. Which not so surprisingly was part of my last weeks trading roadmap. The combination of different techniques available should be used to generate a trading roadmap since I have not yet seen a technique which delivers them all with an acceptable failure rate.
Within the 538,74 pattern you find the 549,92 and you should have noticed the signaling in that area last week. This trading week is about wrapping this up and looking closely to the price and time place the next train will take you. Don’t worry if you are missing one just take the next one as suggested one step at a time.
This weekend I had some time to study a bit and since the crash story’s are so popular lately I would like to add my version of F.U.D. (for people not familiar with the IBM sales strategies; Fear Uncertainty Doubt). I have attached two charts with some straight forward Astro basics stuff (okay fair enough, I did something additional work on them) the first chart is the year 1987 (lol) and the second one is 2007. And while I am at it the third attachment is the update 2007 projection worksheet, red is the actual AEX until last Friday’s close and the yellow is the one we started with in January. No Sir it’s not my intention to scare you just keep in mind the AEX is not going to move to the 1000 (just a number) in a single straight line.
Have fun trading to WIN.
Attachments
The Dutch Clown
Established member
- Messages
- 592
- Likes
- 11
Dinsdag 10 juli
The 557 and a bit hurdle could not been taken out without the help from the Yanks so when and if will be the Tuesday main issue since the Yanks did not help much during our trading day. If you have done your homework you found a number of Technical Analysis New School signals with their price targets and noticed that the AEX was sort of in the middle Monday .
The above year astro charts are differently founded in a more general way if you like. The week Astro chart connects to the earlier ones and the latest consensus is to look for the delta’s in the chart to indicate potential turning area’s in the AEX. Need I say more? Busy day Tuesday.
@Albee
What do you mean by power measuring tools ? Reading the power of ups and downs is a bit vague if you don’t mind my French. Are referring to the strength of a trend perhaps than you should look at something like the ADX. It’s not my habit to guess around so it might be worthwhile to take some time and define what it is you want to achieve.
By the way the strict DayTrader definition does not apply one bit, I could take offence.
Have Fun trading to WIN.
EDIT:1
The opening serves us by delivering yet an other Technical Analysis New School target right at one of the Pietje-lines. As the trading roadmap said it’s going to be fun today.
EDIT:2
Like me you probably have opened your book at the infamous page of the book and just wonder when it will have it’s effect.
Last edited:
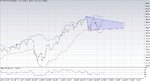
just a picture
EDIT: and another
EDIT2: EOD does not look very positive. A double top in the RSI(7) (blackline) and a reversal candle (red bar). But we are still in an uptrend and shorter timeframes are more positive.
EDIT: and another
EDIT2: EOD does not look very positive. A double top in the RSI(7) (blackline) and a reversal candle (red bar). But we are still in an uptrend and shorter timeframes are more positive.
Attachments

Last edited:
The Dutch Clown
Established member
- Messages
- 592
- Likes
- 11
woensdag 11 juli
Yet an other Technical Analysis new school price target can be checked of our list and given it’s place in the field it could not be dismissed without trading position consequences. This one however was an essentially different one since it was part of a cluster and the above post on the waves should ring a bell as well. New signaling arrived as the AEX dropped as described on the infamous page of the book however no confirmation was in before close.
It’s not enough to have a trade entry, target and direction you will have to define a stop-win as well and while you are at it a number of milestones within the trade that will have to be covered. When you take a trade position overnight you will have to make sure that your trade has covered a number of milestones especially when it has been opened shortly before close. The current trend modus has been covered often already the recently mentioned Pietje-lines are an other aid in covering milestones.
Basically this is the fine line between Analysis and Trading, more specific the area of money management. So this is actually an other learning moment if you took the entry and did not put the “hekjes” in do not panic keep your eye on the ball even though the ball is moving around a bit faster.
Have fun trading to WIN.
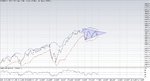
Hennhouse
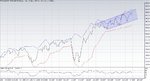
What happened to the hennhouse this week. Did a fox get in or did the roosters get angry?
The DAX and the CAC40 are hesitating.
The DJ, Nasdaq and S&P500 showed an upswing. AEX seems to follow the US indices.
As far as I know, the economy in Europe is stronger than in the US. You would expect then the opposite effects in the indices to what we see now. Or is the US simply catching up for their declining dollar?
Pacito
Attachments
Volume
Rentenier, since the left side of your first thumbnail shows the volume, it's not surprising that the highest volumes appear on the levels where the most tradingdays were. It would be more logic to present the volume per day. Counting the days for a certain level would give the same results imho as the now given volumes. Or do I miss something?
Pacito
Nice chart, from EWI, p49 is the page from Prechters book EW principle.
Attachments
Last edited:
Dear Pacito,
There are two camps when high or low daily volume is involved. One says high volume is important with breakouts, because a large part of the buyers(sellers) have the same view on the price. This has become more or less the default, high volume is good and low volume is suspect. Of course there is another camp who says important price moves must be made at low volume (see the Brown-book or T deMark). They think low volume is essential, because enough buyers(sellers) are still left to move the price in the same direction. They claim that low volume will ensure that not the last buyer(seller) has bought(sold). I don't know which group is right or wrong, maybe both are.
I look at the volume per price level to see at what levels a lot of trading is done. I think that those levels represent support/resistance levels. If at a certain level there is less volume, than prices can move quickly past these prices (nobody seems to trade). On the other hand if a lot of volume exists at a certain level, than parties will do a lot of buying/selling right there. Maybe I am wrong about it, but that's the way I like to think about it. Recently we had a drop in the index and we stopped around 550. That was also the level where a lot of volume was in the days before. Unfortunately I am on another computer, so I can not show you the picture (maybe tomorrow).
regards, Peter
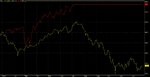
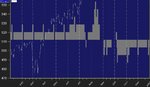
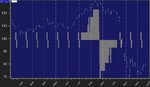
EDIT: I have found the pictures. The first chart is from 10th of july. The index is in a downswing closing at 555. As you can see a lot of volume is at the 550 level. The second picture shows the next day where you can see that the downswing ended at the 550 level and then reversed. Of course only one example does not prove anything, but it is something I keep inthe back of my mind.
There are two camps when high or low daily volume is involved. One says high volume is important with breakouts, because a large part of the buyers(sellers) have the same view on the price. This has become more or less the default, high volume is good and low volume is suspect. Of course there is another camp who says important price moves must be made at low volume (see the Brown-book or T deMark). They think low volume is essential, because enough buyers(sellers) are still left to move the price in the same direction. They claim that low volume will ensure that not the last buyer(seller) has bought(sold). I don't know which group is right or wrong, maybe both are.
I look at the volume per price level to see at what levels a lot of trading is done. I think that those levels represent support/resistance levels. If at a certain level there is less volume, than prices can move quickly past these prices (nobody seems to trade). On the other hand if a lot of volume exists at a certain level, than parties will do a lot of buying/selling right there. Maybe I am wrong about it, but that's the way I like to think about it. Recently we had a drop in the index and we stopped around 550. That was also the level where a lot of volume was in the days before. Unfortunately I am on another computer, so I can not show you the picture (maybe tomorrow).
regards, Peter
EDIT: I have found the pictures. The first chart is from 10th of july. The index is in a downswing closing at 555. As you can see a lot of volume is at the 550 level. The second picture shows the next day where you can see that the downswing ended at the 550 level and then reversed. Of course only one example does not prove anything, but it is something I keep inthe back of my mind.
Attachments
Last edited:
The Dutch Clown
Established member
- Messages
- 592
- Likes
- 11
Een boek heeft vaak meer dan een hoofdstuk dus het boek ook ...
Last weeks AEX movements do fit in perfectly within the Elliott and Astro analysis angles, in fact I would say a bit too perfect so I will have to take the early August signals even more serious. In the mean time the Technical Analysis New School signaling provided once again the close to perfection trade last week and the fine print kept us from entering short and that’s no joke. This coming week is all about the next turn and capturing it in it’s full glory, however stay alert, focused and keep your eye on the ball.
@Rentenier
The red dotted Blau signaling line I have seen in one of your attachments is one worth while studying some more since the resemblance to some other stuff is striking.
@Pacito
The Rooster got irritated since I could not help myself by checking his alertness related to the Technical Analysis New School Signaling (I just had to know) more specific the validating, trading and money management aspects. Mind you I do not respond to the “Hens noise” which is suggestive I did only respond to what has been actually written including some margin for clarification by the Rooster. As I have already suggested here above there is a distinct difference between a “Thought” and the actual analysis level and if you read what has been written rather than what one thinks is written you will get the picture. Just look at the flow, a “thought” is either followed by silence or some rooster sounds, if you read your charts you can perfectly see those coming. The infamous page 58 and the signaling do have identical challenges like any other Analysis piece, nothing works 100% of the time, sometimes not at all or just partly. The book has no answers and leaves one completely in the dark even forwards a suggestive area of study which is completely useless.
As replied I address the Analysis techniques and methodologies so one might learn to read a chart rather than operating like sheep. Unlike the sheep or should I say Hens I am not interested in the conclusion if I do not know and understand what technique or methodology is being used and to what extend and level. All due respect for the Rooster no offence none taken.
The trades to WIN are done not by looking at the current swing but by identifying the next. Once again there is a huge difference between Analysis and Trading so quite a bit of effort has to be put in the conditioning and money management in order to get the P-ones.
Have fun trading to WIN.
The Dutch Clown
Established member
- Messages
- 592
- Likes
- 11
Dinsdag 17 juli en niet omdat de wens de vader van de gedachte is
Nothing happened on Monday ?! Well look again and a bit closer if you please. You have received a present in your chart on top of the existing signaling. However the connected stop-win had to give in some of it’s strength as well not yet dramatically a sign. When asked what the Monday afternoon attachment was I responded, my airco switch projection but it’s a bit off due to the fact that Mamaloe opened the windows to get the smoke out.
So let’s have a look at the Tuesday airco projection. As I have learned to express; “ just a thought” however when combined with the Technical Analysis New School signaling and this weeks event, you dig. Trust you will be able to put things in perspective.
Have fun trading to WIN.