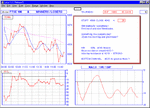
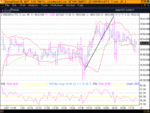
Is it interesting that in the rapid fallout post the Fed decision, FTSE appears to have stalled at the 62% retracement of the rise from 20 May. Also both NASDAQ and SP500 failed to breach their respective near lows recorded on 9/6 of 1597 and 972 respectively. Any thoughts, apart from get a life!
You are using an out of date browser. It may not display this or other websites correctly.
You should upgrade or use an alternative browser.
You should upgrade or use an alternative browser.
Bonsai,
It maybe Wimbledon and the FTSE may have not confirmed its direction as yet but more of the same please with over 100 points on offer today you can get a percentage of that any day.
My chart does not include the first couple of hours (still in holiday mode) but the 7 trends of today there was a conservative 110 points I wish I had continued to trade throughout the day.LOL
Kevin 🙄
Attachments
morning
kevin
they may have been on offer but I have to say if
anybody took more than 50 pts I would definitely
have to take my hat off to them.
personally, all I can say is the fewer days like that the better.
- I bet the spread betters had a field day -
kevin
they may have been on offer but I have to say if
anybody took more than 50 pts I would definitely
have to take my hat off to them.
personally, all I can say is the fewer days like that the better.
- I bet the spread betters had a field day -
Lambchops,
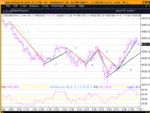
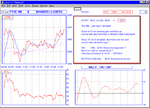
First I establish the current trend using the 2 period SMA (light blue line) on above 5 min chart illustrates this, but the same set-up can be used on any time frame. The green line is a 13 period SMA however this is used for trend rather than entry analysis but I tend to prefer the 34 EMA for this purpose particularly when using a lower time-frame.
Having established the current trend I would place a speculative entry at the trend change on the SMA, and take further positions only in line with that particular trend indicated by each time the SMA follows the trend or by using a very short term trend line from the closing bar positions to show a further move in the trend.
I tend to use both RSI and Bollinger Bands to assist in taking profit but my entry signals come from the upper chart using the SMA as a form of price pivot. Its not as good as following a price pivot or price trendline but then it offers a filter to some of the whipsaws you get from just following price action.
I only consider trades in line with the particular trend at the time, but remain aware of the daily trend overall so when the trend moves against the stronger one I am careful not to expect to much from this move as it may just be a congested period before the original trend is resumed.
I have displayed the 5 min chart because it covers the whole day without depressing the screen although I tend to use a 2 min chart although I find it can make you trade to often. I would advise trying the 5 min for SB as you have to deal with the wider spread but the faster charts are fine with Futures as you are often only having to contend with a spread of 0.5 - 1 point on the FTSE.
Obviously you do not have to keep trading the moves within the trend and can take a positional trade at the trend change and ride it through. My set-up was originally put together for me to trade on signals that appeared frequently throughout the day because I did not have much time to trade and did not have the luxury of seeing a trend through. Now I have a bit more time so I apply both methods using SB for the positional or trend change trade and Futures for the moves within the trend. I still play the moves within the trend because that is what I have had to do for the past few years and cannot get out of this style of trading. LOL
Hope that helps
Hi Bonsai,
I agree that 50 points would have been very nice but those 100+ points were available and achievable, providing of course you have or are prepared to remain in front of your computer for the duration and you have the patience to sit it out and maintain your trading strategy. That's why I find also trading within the trends helps me otherwise it would be extremely boring. LOL
However while I admit to having done exactly that in the past being in front of your computer all day is an extremely long time and that is why I set myself a simple target of 20 points which can be obtained within a much shorter time. When I can I do sometimes spend the majority of the day trading particularly during the cold months or when I am in the right frame of mind but often and especially during the summer months I would not wish to spend more than 3 hours in the morning trading.
Kevin
Kevin
Thanks for setting out your trading plan,I have been searching for some thing like this to bring it all together.I have tried day trading and at the moment,I am just not good enough.So I will be trading over several days and this method just suits me.
Is this your own idea or did some one put it together for you.
Also how did you arrive at the 13 and 34 ma's.
LOL. Regards
Fluke
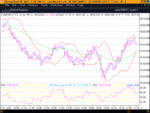
The answer is yes, I put together my set-up to suit my own needs and it will most likely not suit many others. It has taken many hours of research and testing to get to where I am now.
There are other indicators and systems that produce better and quicker signals but they are no good if you cannot use them well. For example I know that many here make very good use of CCI and it does produce an earlier signal than the RSI that I am using but I have become so familiar with the use of RSI that I cannot get away from the signal it provides and found myself double testing the CCI when I use it with RSI so it does not work for me. What I am trying to say is just because I have used RSI as my lower indicator you could easily replace it with your own preference.
I would only say that I find 3D charting better for me so I would at least advise that you make use of one lower indicator to back up the upper chart selections. (That’s for those who trade just from upper indicators such as SMA's - still a good system).
The nuts and bolts of my system are that it should be both simple to apply and simple to see the entry and exit points on the chart. Each component plays its part, some acting as confirmation. For example the Bands are not essential because you can use the RSI for your overbought/sold indicator. However I find the Bands very visual and so I have become very familiar with the patterns they create and what to expect from both the RSI and price at certain stages of the bands development.
The 2 period SMA is close to the price and this is my main entry tool combined with the trend line formed by the SMA itself and not each and every move the SMA makes. The individual SMA pivots play there part when trading within the trends. This is where I may have originally entered at a trend change, taken profit if the price moved to far (got to far away from the 2 SMA or outside of the bands) then I would wait for the next appropriate move from the SMA or closing bar sequence for the next entry in the trend. These price moves do normally offer at least 2 or 3 entries before the trend changes.
The 34 EMA is another trend assessment and this was taken from another system used along with CCI. That system would not deal with reversal but wait for the price to move either above or below the EMA. A position would be taken when the EMA was sloping up or down in line with the current price trend. This would normally mean the price had already reversed and now fallen back a little to create a supporting pivot for the next move in the trend. This proved to be a very good return system (80%). However I like to be able to trade reversals but there is an element of risk, which is why I do not just trade all the Band or RSI reversals.
I have found to my cost that you have to be a very good trader to get these right all of the time because you are trading against the trend. Very often there will be a small reversal in a trend, which may only provide you with 4 or 5 points yet the next deal with the trend normally provides double, or more. I have found my set-up to be generally less risky because it encourages you not to trade individual price reversals in a trend (pull back) until you get a trend cut on the SMA. If in doubt at this stage, then all you need do is wait for the next lower or higher pivot to be formed and or by using an extending trend line you will often find if you use the existing SMA trend line when the price then moves back up or down after the trend change you will find that the price will go close to this expanded line and then continue with the new trend and this becomes another feature of the trend line for entry use. I will attempt to attach charts with examples.
As for the 13 SMA I was also using this from an SMA trading system where each time the price formed a pivot supporting the direction of the SMA an entry signalled would be generated. However with my adapted set-up I no longer feel the 13 SMA is required and the 34 EMA is very good for the 1 - 3 min charts. Because I am using the trend line of the 2 SMA it breaks up some of the data into trends that the 13 SMA would miss. The trend lines are again simple and clear the basis of this set-up. I believe that if you follow a clear strategy then without realising it you will be trading clinically and with discipline without trying.
With this system you must enter and exit as soon as a signal presents itself, second-guessing and you will get caught out if you are attempting to trade within a trend or using SB as your method of trading. However the positional trade is more relaxed and the entry is not so clinical if trading with the main trend of the day, however it might affect your profits LOL.
That should clear everything up.
Kevin
Kevin.
I do appreciate the time you must have spent to day typing up a very detailed answer to my simple question.You have helped me sort out some of the thoughts and idea's that have been going round in my head lately.I have been suffering from information over load and wanted to set out some sort of trading plan,but did not know were to start.
I presume the green line is 34 SMA and the blue line is 2SMA.
I hope my simple thanks are enough for your hard work to day.
Kind regards. Jon.
Ftse like to close its gaps ! This alone is worth many points and
more often than you might think.
That was my only trade today for +10. After that off to the tennis.
But it seems that once again, nothing was missed.
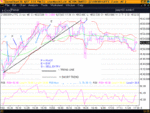
I dont know if this is a rounding bottom/reverse H&S or what.
But it was unlikely we would break the bottom line of the channel without some pause or correction. So far the correction seems weak.
more often than you might think.
That was my only trade today for +10. After that off to the tennis.
But it seems that once again, nothing was missed.
I dont know if this is a rounding bottom/reverse H&S or what.
But it was unlikely we would break the bottom line of the channel without some pause or correction. So far the correction seems weak.
Attachments
Bonsai
When you refer to the gap today do you mean after the fall or the remainder of the session being 😆 taken up with recovering what the FTSE had lost before 10. Your 10 pts did this come from the reversal or the early fall. When you have time could you explain your gap theory in layman's terms. You know me I just put everything into trends.
By the way what FTSE data are you recording for your 15 min charts, is this from D4F and if so is it the bid or offer price.
You must be a past master now as you got the floor trader trainee's target in 1 deal. LOL When I discovered this fact It made me sit up and think. (trainee's target not your deal LOL)
They did not want the FTSE tp go lower than 4050 today, I had a couple of sells and each time the sell price stretched to 4045 moving away from the buy price they would not budge the buy price. The move down eventually came after several attempts but did not stay under for long and finished above after hours.
Kevin
Similar threads
- Replies
- 866
- Views
- 119K
- Replies
- 478
- Views
- 75K
- Replies
- 197
- Views
- 35K