Dow Intraday Charts 20 Sept - 24 Sept

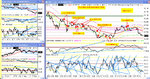
hope so graham, 10,280 is my hopeful target. would need a minor miracle to hit it by friday close though :eek:


as long as we dont break yesterday's low significantly in the open session, then we should be alright heading north..

not holding my breath.. yesterday's market fell 30 points more than my patterns suggested it would..

hmm...
 
Yeh – It’s very likely to home in on 10070 ish (64..?) being the 50% retracement of the recent big move up and a prior S/R level….and the futs are fading down sub 10100 at the mo’…..

Possibly the employment data at 13.30bst and Leading indicators data at 15.00 might provide some bounce potential…..?

Ok – so we’re having a fairly typical ‘post Alan’ tanking, and the bulls will be looking for an emphatic higher low now relative to 9800, and another chance to break north from the 8 month tight range..

They might be lucky………

ps - Graham - thanks for the volume chart yesterday......

edit - probably (definitely..?) too early to even think about it, but on the basis that they often tank it much further than you think they will – might we shortly see another uptrend channel form with a ‘bottom’ around the 61.8% retrace level at 10000 ish (2nd chart attached..)

Nah – impossible…. :confused:
 

Attachments

  • 23-09-04.gif
    23-09-04.gif
    19.8 KB · Views: 177
  • 23-09-04a.gif
    23-09-04a.gif
    20 KB · Views: 189
Last edited:
my understanding/version of reversal magic (see other threads) implies we could see a turn early in today's session. with possibly another one later in the afternoon/evening...

cant give precise times, as im doing it by eye, but it looks like an up to begin with, then down at the end day...


hmmm
 
are you bluffing TS, or have you joined the world of Delta?

Bramble and Chow are your men if you want to find out more :)
 
Maybe that expanding triangle was bearish after all (see attached).

Despite repeated RSI/price divergence yesterday all the price wanted to do was sink. One of those days when the only way is down I suppose.

Edit - if you have Murphy's book on TA take a look at the expanding triangle diagram on page 330, it looks very similar with its sub waves. Now all I need to do is figure out what it means will happen to the price next lol!

Better luck today!

Justyn.
 

Attachments

  • chart.gif
    chart.gif
    6.4 KB · Views: 214
Last edited:
justyn said:
Maybe that expanding triangle was bearish after all (see attached).

Yes it looks that way,justyn,but most of you ignored what the market was telling you,im short from 10235 looking to take profit here, at 10060 but im getting ready to short again on any pull backs.20 or 30 points above 10100. If filled I will stay short Friday and say in till the close.

CJ
 
but most of you ignored what the market was telling you,im short from 10235

sounds quite clever with the benefit of hindsight, telling everyone that you are short when the market has been falling for two days...

but how about turning up in advance of the move when you are placing your trade, and posting charts or data to back up your decision.......?

much more informative........ ;)
 
tradesmart said:
sounds quite clever with the benefit of hindsight, telling everyone that you are short when the market has been falling for two days...

but how about turning up in advance of the move when you are placing your trade, and posting charts or data to back up your decision.......?

much more informative........ ;)


Yes you are right, it looks like im trying to look smart, I was thinking that as I was writing. But it's the truth. I don't need to look smart, it not in my make up. :rolleyes:


CJ
 
Is there such a thing as a target for an expanding triangle? I've never read about them anywhere.

If the target is taken from the mouth of the triangle, assuming the mouth is at the point where the support line was broken, then the target would be in the region of 250 points which would be as low as 9915.

We're down to 10032 as I write so only 100 points or so away.

Any expanding triangle experts out there who can tell me if I am talking nonsense?
 
So, which way will the 7pm kick take us ?

Has the Dow fallen far enough for players to want to take profits, and thus provide a move up this afternoon ?

They are starting their lunches now.....
 
sell dow at 10,052. 1 point ( just in case htis is all there is ).

limit another sell at 10,080.
 
That's a great post GKB - very magnanimous of you I must say! Not enough people are prepared to admit their failings, and I include myself in that group. :eek:
You may or may not realise that posts like that one, help others to stick with it, and recognise that everyone is human. We all need so much stamina in this game that if we can get motivation from unexpected sources, it helps us all persevere.
I remember about this time last year, after posting about a string of losses, that a number of regulars came out and posted about their similar experiences and believe me it was comforting to know! (Thanks again Frugi, Rosso et al)
Keep up the posts, as I believe they throw a different light on the stage! :)
Cheers
Quercus
 
Hi

First of all well said Quercus. Agree with the lot. Can't improve on your post.

Null trade today but there was potential.
Remember I can only trade half the day, after 5:00pm. I tend to rush into a trade when I get home but that said I thought A was reasonable and if anything B was the risky one. As it turns out it was B that bailed me out for break even [courtesy of CM and magic 32 theory]. Still recovering from the shock I wimped out of the next short which would have given me a nice little earner say 20 points? Ah well we live and earn.

Remember GKB we never make a loss just a negative profit ! :LOL:

Regards

Bill :)

+-15 ema Rules are

1. Short if price crosses 100ema and touches/crosses 100ema+15
2. Long if price crosses 100ema and touches 100ema-15.
3. Short if nd and/or price is 100ema +15 [or v close]
4. Long if pd and/or price is 100ema -15 [or v close]
5. Don't trade in the 1st hour
6. Stop losses above/below obvious SR
 

Attachments

  • dow_230904.gif
    dow_230904.gif
    39.8 KB · Views: 220
Agreed- one can learn a lot more from other's errors + you get the comfort factor of knowing you're not the only failure out there.(In the nicest possible way).

More drop, 1 1/2 day's divergence. one more should do it to get a turn around....
With definite hindsight, there's 4 slope changes on resistance.... That 3rd one should have/ would have rung a big alarm bell, had I spotted it. C'est la vie. :eek:
 

Attachments

  • dow 23-09-04 10.gif
    dow 23-09-04 10.gif
    38.7 KB · Views: 225
The small gap down and failure to penetrate back up through 100 should have got you shorting....The bad news was the 30 point pullbacks- hard to take as we're not really "flying". Closing after the PD and re-entering as the price hugged the downtrending 100MA would have made sense....Then an easy exit on PD/32 /DB. Then a chance long if you spotted the triangle... but what a messy close.
 

Attachments

  • dow 23-09-04 1.gif
    dow 23-09-04 1.gif
    29.5 KB · Views: 280
GKB - great post - just try not to make a habit of them. Seriously though, I've been there too and only really avoid it now with an automatic stop fired by Ninja Trader (my IB front end) every time I take a trade. Thankfully I have nearly always avoided the temptation to tinker with this once it is set.

23rd September 2004

To accommodate the potential higher number of shorter trades I am now taking, I am going to enter and automatic hard stop of 10 points as opposed to the 35 I have been using.

10:12 PD off 64 (triple on CCI) for superb long but after all the failed divergences yesterday I am not taking them as entries today. Good for 20+ back to 100 ema.

10:21 Pulls back off 100 ema but combination of PD before and failure to break TL on RSI and CCI kept me out of the short.

10:29 TRADE ENTRY 1): Short 10085 (78 on YM) on second pull off 100 ema, this time with TLB.

10:50 TRADE EXIT: +24 on TLB back to upside with PD on RSI and CCI.

11:03 TRADE ENTRY 2): Short 10074 (68 on YM) on next TLB down.

11:09 TRADE EXIT: +4 on TLB back up.

11:19 TRADE ENTRY 3): Short 10071 (63 YM) on another TLB to downside.

11:27 TRADE EXIT: -2 on no follow through after nearly 10 mins but before TLB so a bit premature (nervous after last down move formed higher low). Would have been two points worse waiting for TLB.

11:39 TRADE ENTRY 4): Short 10073 (try again!).

11:50 TRADE EXIT: +8 on TLB back up. Whoosh - thank goodness I got out.

Will break now until range opens.

Well that was smart - missed a corker on the TLB from the 100 ema at 12:16 for +12 (exit at 12:33).

My biggest weakness as a trader (well, one of them, anyway) is that I look for any excuse not to keep trading when I'm in a winning position. Today is one of those days that is working perfectly and it is almost as I think it is too good to be true. I need to be more mechanical and just keep taking the signals.

12:44 TRADE ENTRY 5): Short 100050 (47 YM) on TLB to downside below 100 ema. Would feel a lot happier about this one if I'd already bagged the one I missed above!.

12:54 TRADE EXIT: +14 on TLB to upside.

13:28 TRADE ENTRY 6): Short at 10043 on TLB below 100 ema.

We've now had a 3 peak PD on the CCI 10 minute chart which suggests we may have exhausted the downside action.

13:44 TRADE EXIT: +1 on TLB to upside.

14:55 TRADE ENTRY 7): Long 10057 (51 on YM). We never got more than 20 above the 100 ema (quite) and had an ND on the last peak at 64 level so this is high risk

15:00 TRADE EXIT: B/e on TLB to downside. I think that confirms that long is risky here - I'll keep out until direction clearer.

15:16 Could be break out of triangle to upside. T1 around 75-80. Not much obvious follow through.

+49 from 7

+86 for September so far
 

Attachments

  • 20040923.jpg
    20040923.jpg
    323.5 KB · Views: 250
Top