You are using an out of date browser. It may not display this or other websites correctly.
You should upgrade or use an alternative browser.
You should upgrade or use an alternative browser.
This up/down channel is still in limbo, but a little less so than yesterday. You all spotted the exp. triangle, but no one mentioned the failure to reach support on the last move. That to me says up. So pay attention to that.Should we also take not eof the slope change on CCI PD in support of this?
I don't agree that an expanding triangle is bearish. OK, maybe with a flat base line, but that's not how I read it. As for a big drop, It's not going to happen intraday, is it? So we don't care.The best I can see is a drop to channel support at 200.Tomorrow will tell, as always.
I don't agree that an expanding triangle is bearish. OK, maybe with a flat base line, but that's not how I read it. As for a big drop, It's not going to happen intraday, is it? So we don't care.The best I can see is a drop to channel support at 200.Tomorrow will tell, as always.
Attachments
Another hard day with just one decent trade on offer, taking the bull flag from the open with 266 target, finally pushing 280 for tops and 30 odd points.Plenty of short term divergences for the scalpers . If you got the bear triangle, did you get T2 and T3? T2 was the triangle target and T3 was the pullback target from T2.
Attachments
bansir
Well-known member
- Messages
- 494
- Likes
- 42
ChartMan said:Plenty of short term divergences for the scalpers .
Hi folks,
I've been playing the NDT/PDB's quite a bit with some success.
I notice we're down to playing just two peeks or lows on RSI rather than looking for the traditional third peak.
Is this significant? Maybe I'm getting impatient or maybe it comes with the tighter ranges we're seeing?
In the end I guess we don't need to explain it, just adapt to it. 😕
Cheers,
Neil
tradesmart
Experienced member
- Messages
- 1,286
- Likes
- 22
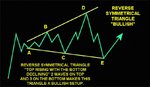
Yeh - apparently 'expanding triangles' have something for the bulls and the bears - take your pick folks - it's all down to the orientation.......... 😉
It appears that if one follows a descent it could be bearish - if it follows an ascent, bullish - (almost) as simple as that..........!
It appears that if one follows a descent it could be bearish - if it follows an ascent, bullish - (almost) as simple as that..........!
Attachments

Last edited:
TraderTony
Active member
- Messages
- 180
- Likes
- 1
Thursday 16th September 2004
Sick today - lurgy off the kids - but I nailed a good entry only to let most of the profits slip off the table.
9:49 TRADE ENTRY: Long 10246 on support at 100 ema after small gap up and triple PD on the 10m chart (from yesterday). T1 on flag around 65 (64!).10:13 Hits T1 at 64 and then yesterday's swing high at 68 where it stalls. Looked like another bull flag then starts to drop. T2 around 85. Didn't quite get there (or possible miscalculation) before showing signs of climax/reversal, although no ND yet. It was third leg up though and looks like we could be coming down. I notice there was ND on ES on last move up. In retrospect I should have closed half when it reversed around T2 on the third up move. But RSI could be recycling for another move up - down nearly 40 with price down just 10. Mmm - I think that's looking like wishful thinking as it starts dropping. Then tries another push up with TLB on RSI but no volume. Soon back down. I messed this one right up - should have at least got half off for +33. Slow death drift back down instead with NQ leading the way.
11:43 All the way back to 100 ema. Very annoying. This is a flag right at the channel mid line on the 10m chart so there could be some more upside but I really should have bagged some decent profits earlier - especially with movement being so rare right now. This is not looking good. And drops below 100 ema. Jeez what a balls up. And through 64 - bad numbers. Jumping all over the place.
12:28 Well, now I'm in this situation, I'll hold on for another move up or a stop out. There has been a PD and the retracement of today's move up is only 50% so I could still get lucky. Moves up quite sharply although not too much volume. TLB on CCI and price. Needs to take out 275 and then run the highs (!!). Stalls at 72. Could be flag with T1 at 90. But it's drifting down again, much like this morning. Tries a half hearted move up but goes nowhere and forms first ND on RSI. And down it comes. Was looking quite strong again for a while but it needed to test the highs. I'm a bit surprised it didn't but NQ seems to be the problem again. Drops to 100 ema again. And then to 64. This is a tough one to read. Like this morning, there seems no downside pressure or volume, but the expected up move never happens and it slowly slowly creeps down wards, albeit using up a huge amount of RSI relative to the price. The up moves are fast and powerful, the down moves slow and weak, but they just keep on and on and on. 64 fails. Here we go again.
13:43 Move to upside above 100 ema/64 fails and gets slammed down. Then sideways.
14:03 Pushes up with volume. Just peeks over swing high at 75 but then drops off sharply. Really needs to take out the highs convincingly here. Not a hope. Very weak move after all that. Soon back to 64. ES much stronger than YM here. And bang - down it goes.
14:13 TRADE EXIT: +12 on dropping below 64 and previous swing low. I've had enough of this. Sick, headache and I need to go to bed and am still angry at missing the (at least partial) exit earlier.
Probably get a big move now (!) but I'm off to bed feeling very sorry for myself.
+12 from 1
-17 from September so far
Attachments
TraderTony
Active member
- Messages
- 180
- Likes
- 1
These rules were posted in Woodie's room yesterday:
1. I will not trade every day just because I feel as if I have to.
2. I will develop a proven trading system, and realize that one bad trade does not negate the system.
3. I will set up proper MONEY MANAGEMENT, use my exits, stops and not allow myself to get into hope mode. I will not change in an effort to create "just a little more" profit.
4. I will not let emotions sway my trade decisions.
5. I will approach trading as if it is a business. I will be strategic, and logical.
6. I will learn something every day, no matter how small, that will give me a greater trading edge.
7. I will keep a trading journal, and note when and why my analysis failed and succeeded. I will review this journal weekly.
8. I will not fight the market. I will capitalize on whichever direction the market is going.
9. I will take small losses rather than let them become large losses. I don't have to be correct with every trade.
10. I will become an expert in one area of trading, whether it be options, one certain stock, or an index. I will master every detail particular to those trades.
11. I will invest in my success, I will put in practice time, playback time or any thing else that will help me to be a good trader
12. I will act upon what the market is doing, rather than what I think it "should" be doing.
13. I will not allow myself to create trades or make up trades just so I'm trading as i know this will lead me to diaster.
TraderTony
Active member
- Messages
- 180
- Likes
- 1
Yes Pat, you're right - it looks better this morning!
I tend to draw trend lines on the indicators so TLB is often a trend line break on the indicator (which I think CM refers to as a R/S switch). Seems to give advance warning of a change in trend/direction.
I tend to draw trend lines on the indicators so TLB is often a trend line break on the indicator (which I think CM refers to as a R/S switch). Seems to give advance warning of a change in trend/direction.
Bill
Active member
- Messages
- 160
- Likes
- 1
Bill goes live....
Home @ 5:30pm and logged into CaptialSpread simulator to find that the Daily Dow was closed. Why? Is it because it's Twitching day? Can anyone shed any light on this. Do they not offer a Dow cash on such a day?
So what now I thought. Dare I trade real money [on Fins]? Ooo Err... not sure.
Ah well so what if the kids do have to go to school without shoes and the missus has to scrub floors and if we don't have a shilling for the lecky meter what the hell... Ooh forgot I need electicity to trade! 😱
So it was eyes down look in.
Two trades are annotated on the attached chart. At first I was only going to look for standard Dow strat entries so I took the short from a rather dodgey looking tri but at least it had a T1 so knew when to exit. By this time I felt confident and decided that the PD gamble and a +-15 rule 4 was worth a punt. Exit on +-15 rule 1. I'd made +28 so I thought I'd best not push my luck any more. And besides there did not appear to be any more obvious entries.
So we don't have to go fishing through dustbins tonight... we can have steak!
Regards
Bill 🙂
Attachments
Last edited:
tradesmart
Experienced member
- Messages
- 1,286
- Likes
- 22
Well done Bill, with the quality of your posts you should be dining on venison or caviar………..
(I’m sure that you will be soon…….!)
Regards........ :cheesy:
(I’m sure that you will be soon…….!)
Regards........ :cheesy:
Looks like I got it about right yesterday, but it's still not clear- up channel or down channel.? What is clear is that the old up channel probably won't be achievable. If it is an up channel, it will be a correction. i.e. same slope, different origin.A sideways slip. The down channel is still in force for now, approaching resistance, with plenty of room for the upside.
Attachments
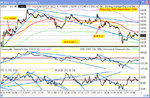
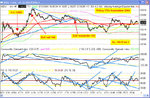
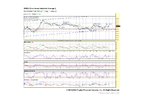
Yet another poor day to finish off a poor week. Nothing much to get your teeth into today by way of nice entries until the PD off 264, unless you shorted the top at 315 at the 300 mark after the H&S had formed. If you have no idea of direction or an entry point, try looking at the least squares moving average....( in yellow). Just be aware of thr risk if the open gaps... the LSMA tracks very quickly, increasing the likelihood of getting whipsawed.
Attachments
TraderTony
Active member
- Messages
- 180
- Likes
- 1
Well done Bill - excellent way to finish the week.
TraderTony
Active member
- Messages
- 180
- Likes
- 1
Friday 17th September 2004
Quadruple witching, numbers at 9.45 est.
10:11 TRADE ENTRY: Long 10261 TLB on RSI after retrace to 100 ema. More downside before it starts up . There is an ominous neckline formed for H/S to downside if it drops back. Makes it up to 75 where all the resistance was yesterday and stalls. Then another push up. Bill's system might be going short around 280 and right on cue it pauses. Then a push up to the highs. Could be buying climax and reversal here. No - keeps up - going for 300.
10:50 PARTIAL EXIT: Half off at 10302. +42. Just because ... I don't want to give it all back again, it seems inevitable there will be some selling here, and there is a TLB on the RSI. However, no clear exit so really I should be holding on.
10:54 QED! Up again. T1 350? Not sure of the calculation here. But 10m channel top is around 323.
10:58 First possible ND peak. (Triple if you count the open gap but I won't). Drops back to 300 level but using lots of RSI and not much volume. Hoping for at least one more leg up. But, like yesterday, it keeps on sliding down.
11:35 TLB on RSI for possible run up. Very half-hearted move up getting no where near highs. Not looking good here. Back to 100 ema a second time. Unlike yesterday, the NQ looks strong. But it won't go up. Chart looking remarkably similar to yesterday's which is ominous for the long. And down through the 100 ema. Everything says more upside, but they keep creeping it down. 50% retracement now from peak.
12:21 Another push up. Breaks TL on price and RSI.Volume increases but not great. If this is a flag T1 should be around 350 (which would also be top of daily channel - but I'm getting ahead of myself here). Stalls dead at 300.
13:00 REMAINDER EXIT: +30 on price dropping below neckline an absence of any upside follow through. I struggle with this action - just like yesterday - where everything says consolidation before more upside but it doesn't happen. I don't want to give it all back again but I'd prefer a more concrete reason to exit, like a nice three peak ND!
Need to look after kids now but should be back later.
Average: +36 from 1
+17 for September so far.
Attachments
week ending 17/09/2004
Hi,
Nicely volatile today with some useful swing trades.
Overall, I still think we're finishing 5 of C. The 5 itself is probably a triplet abc of small degree, there may be a small c up to finish it, I don't know.
Today was a day of playing resistive / supportive volume spikes using marketvolume.com. I'm not allowed to paste their graphs, sorry.
09:30 started off with a small gap up, I was expecting that c of 5 to come so felt quite comfortable with short term longs. Nice resistive spike for the high at 10:00 and another smaller (still significant) spike at 11:00. Expected a pull-back but unhappy with shorts for a while. Small supportive spike with oversold TA got my first long at 12:00 but an equal resistive spike got me out at 12;30 for +9. Looks like more pullback to come and looking for an equivalent supportive volume spike to compensate for the morning's resistive ones. Nice supportive peak at 13:45 got my next long but too soon, the next low showed as divergence on RSI and CCI with a cross over on MACD, so went for my second long. Oversold an hour later with a resistive spike larger than the originating supportive one, so was happy to close both longs for +22,+28. Towards the end of the day there was a wide increase in resistive volume, so decided to take a chance on one short. I don't mind the potential upside to 10350 from here as max risk for me, with mental stop at 10430. I'll keep this position for the long term I think, but we'll see. Just at the end of the day the market manipulators showed their true worth and presented a HUGE delayed resistive volume surge which is reported as highly significant.
Happy to keep one short position over the weekend.
Results today +59 for 3 positions; plus one short at break even carried over.
Results for the week +230 Dow points.
Gonna spend the weekend living normally for once, it's been a tiring week. 🙂
Attachments
Last edited: