You are using an out of date browser. It may not display this or other websites correctly.
You should upgrade or use an alternative browser.
You should upgrade or use an alternative browser.
TraderTony
Active member
- Messages
- 180
- Likes
- 1
Wednesday 15th September 2004
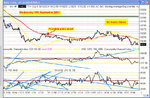
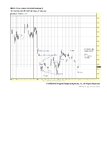
Wimped out of the drop first thing then too cautious to take anything before packing up for the football early.
Gaps straight down through 10 min channel and yesterday's support at 300.
9:57 Bear flag breaks downwards. Possible short entry but too far from 100 ema for me. Could get a bounce off 64 here with PD (albeit including the opening).
10:19 Brakes down through 64 after looking like it was going to bounce on divergence.
10:30 Possible triple PD to upside now on CCI. Nope - down again. Well, so wary at entering so far away from the 100 ema I've missed all of this move.
11:03 It is creeping back towards to 100 ema (albeit in a possible bear flag) but there has been lots of PD on the CCI and RSI so perhaps too late to join the downside action.
11:05 OK, breaks down again but no immediate follow through and fails (so far) to reach lows. Downside could be running out of steam. Very undecided action here.
11:24 Right, hits 100 ema but not sure about taking shorts here (as mentioned above) after all the divergences. Stops dead but no immediate reversal.
11:33 Then a pull back to the downside with TLB on RSI. Didn't take it. It is not going down quickly, but it is going back down. Glad to have passed on this short, even though it would be in profit. And it keeps dropping. NQ looking most weak here.
12:06 Second bounce off 100 ema sends it down more again with a bounce off CCI zero line. This time it might drop but I'm still sitting aside after the earlier divergences. Frustrating. Creeping down.
12:45 New lows. Looks like I've been far too cautious today. But it bounces up strongly again so could have been a run on stops. First big divergence on 5m chart. No follow through to upside though as 100 ema still holds. And it starts creeping down again.
13:13 Moves right to 100 ema with TLB on RSI and stalls again. Then eventually pushes above on all futures. Not much volume or follow through though. Needs to take out swing high at 260 to have any upside chance.
13:57 Takes out swing high - now it needs to take out 264 - still only 10 points or so above ema so not looking for longs yet. Heavily O/B too. I expect Bill will be looking to go short any moment here. Pops above 64 and stalls right at it. And it's coming down again.
14:12 Dropping sharply now with some volume. No divergences or anything yet though. All the way back to 100 ema.
OK this is a strange day. First one I can ever remember when I haven't taken a trade. Not enjoyed it, but at least I know it doesn't kill me. Also, there's not much that will keep me away from the market, but watching Liverpool in the Champions League is one of them (sucker for punishment). I'm going to switch off now to stop me having to manage a trade through the action.
0 from 0
-29 for September so far (added it up wrong yesterday)
Doesn't look like I missed much but if I had taken the short on the reverse back down off the 100 ema around 11:30 and stuck to the rules I could have exited at the close for +20 or so, but it could have gone either way. Another 35 point range after the first hour.
Attachments
Bill
Active member
- Messages
- 160
- Likes
- 1
A lesson in how to guard against a power cut
Hi
Divine intervention today.
Home just after 5.00pm to see that market sentiment was firmly negative so +-15 rules should not apply. I was looking for shorting opportunities and when the price touched the 100ema line I decided a 'toe-in-the-water' 1/2 size trade was appropriate. No! Market sentiment seemed to have changed. In hindsight there may have been a tri that I should have spotted but it was not well formed. The price progressed up to the ema +15 and I decided to try the rules again with the other half of the short and SL @ 10275 for both halves.
At 7:30 I had to go out for half an hour and set a limit order just in case I missed something. Good job I did as when I got back there had been a power cut and my datafeed was lost and MySql was screwed etc etc etc.... [Might get a UPS]
If the chart looks a bit wonky you know why.
+2 points today.
blackcab
How do you find those rules overall?
This is an experiment so don't try it at home. I simulate the trades using CapitalSpreads.
I think CM's Dow strategy works well for a volatile or trending market but you have to make sure you do not lose too much when the price just drifts sideways. If you read the dow document you will see that the recommended entry is after a pullback from crossing the 100ema line. [Other entries are said to be gambles]. On a sideways day this is likely to cause several small losses. I am looking for a simple method of trading in these light conditions. Whether this is the answer I'm still not sure. The difficulty is determining whether the day is trending, sideways or one type morphing into another [like today].
A simpler alternative, and probably what evryone else does, is take an entry from pd/nd on a sideways day [i.e.the gamble entry] then you stay within the standard Dow rules.
Probably does not answer your question but I'm sitting firmly on the fence.
Regards
Bill 🙂
Ooh! look I'm a senior member.... Is that cos I'm nearly 50
+-15 ema Rules are
1. Short if price crosses 100ema and touches/crosses 100ema+15
2. Long if price crosses 100ema and touches 100ema-15.
3. Short if nd and/or price is 100ema +15 [or v close]
4. Long if pd and/or price is 100ema -15 [or v close]
5. Don't trade in the 1st hour
6. Stop losses above/below obvious SR
Attachments
Missed this mornings action, CM spot on again with the 100 pointer.
Took a long off the triangle @ 11.10 ish exited after failure to reach 264 (looking at it now i've only just seen that it bounced of ema so i should have exited earlier for more pts) but still delivered +10.
Took another long off the bounce at 232 and exited after failure to break 64. for another +21.
Thought about the short especially with the pull back to 100ema @ 15:27 ish but decided against it being so late in the day and with all the selling i thought there might have been some short covering and didnt want to be on the wrong side of it.
ended +31 for the day.
Attachments
Yes,Carlos looked to be spot on, but I was thinking in the opposite direction last night. Then I saw the pre-market and promptly change my mind. That's the beauty of doing homework and making a plan that you can execute in either direction. It really is important to argue the case from both directions. I think quite a few people take what they see in isolation from the bigger picture and therefore are prone to making errors of judgement......
I said last night if 310 ish went, then we're looking at 225 as the target. It's not rocket science, just basic TA. You don't even need to know what the direction is, just what you should do for either scenario. That alone should get you on the right side of the overall move.From there, it should be less frenetic and more relaxed.If you can achieve that, you'll be trading in a more relaxed state of mind and that will do wonders. No point in being long and spending all day figuring just how you are going to extricate yourself from the clag... 😱
Can we now consider a new down channel? Not quite..... there is still horizontal support at 250, which is just in range ( OK, I know we closed at 230). So ,tomorrow will tell, I think. Moving down to 200 will serve to confirm this down channel.Unfortunately, there is much further to go on the upside before we can say that it is NOT a down channel.
Attachments
Trade of the day, IF you couldn't get in early was the perfect bear flag and target T1 which missed by a point or two. :cheesy:
The rest of the day? messy, as usual,bar the D top at 265 with ND, but closing at 232 and room for upside, but no guessing now....
The rest of the day? messy, as usual,bar the D top at 265 with ND, but closing at 232 and room for upside, but no guessing now....
Attachments
FetteredChinos
Veteren member
- Messages
- 3,897
- Likes
- 40
nice trading guys 🙂
im long from 10,230 looking for the upside CM has mentioned. plenty of room for 10,330 plus to end the week on a positive note.
BUT, if 220 goes convincingly, then we could be in all sorts of trouble and the market capitulates...
ho hum...
im long from 10,230 looking for the upside CM has mentioned. plenty of room for 10,330 plus to end the week on a positive note.
BUT, if 220 goes convincingly, then we could be in all sorts of trouble and the market capitulates...
ho hum...
tradesmart
Experienced member
- Messages
- 1,286
- Likes
- 22
Capititulation…?……nah…..too many bulls about……..(for the next few hours anyway..)
And I thought expanding triangles were bearish?, but anyway, very likely 264 will have another retest today at least imho, particularly if ‘Ivan’ turns out to be wimpier than expected…..and Coke has promised to put some more 'fizz' into its profit bubbles....
The daily chart RSI/CCI clearly shows that the foray up to 364 was an interim top, and after a 500+ point runup in 3 weeks, a pullback was almost an inevitability, and maybe a 38.2% retrace to 10150 ish still wouldn’t disturb the apparent uptrend too much…..
Interesting statistic…..this year, the ranges of the S&P500 and the DJIA have been the tightest as a percentage of the previous years close for 75 years…
(indicating that a major breakout is due……?)
Attachments
FetteredChinos
Veteren member
- Messages
- 3,897
- Likes
- 40
good stat TS. what is your batting average???
i agree though. narrow ranges are a right pain in the derriere...
having to scalp 75 points here and there lol...
question is. which way is the major breakout? Prechter and his cronies is favouring a daddy of a drop isnt he? or has he changed his views??
i agree though. narrow ranges are a right pain in the derriere...
having to scalp 75 points here and there lol...
question is. which way is the major breakout? Prechter and his cronies is favouring a daddy of a drop isnt he? or has he changed his views??
tradesmart
Experienced member
- Messages
- 1,286
- Likes
- 22
I’m calculating my batting average now - http://www.cybball.org/batav.htm LOL.!
FC – Prechter and the Ewavers may well be right about the “daddy of a drop”, but from what level – 11200….?!
But I suspect that we may be at a critical juncture with the current test of the top trendline linking this years highs…..if the test fails, it’s gonna be a long drop….
On a sartorial note, are fettered chinos related to bondage pants……?!
Attachments

FetteredChinos
Veteren member
- Messages
- 3,897
- Likes
- 40
kinky 😱
FetteredChinos
Veteren member
- Messages
- 3,897
- Likes
- 40
ok, we are back up to 10,260 now. crucial point. will we push onto 10,330 and beyond. or will we hit trouble and break yesterday's lows....
i still favour the former, but this level is proving a tricky obstacle....
i still favour the former, but this level is proving a tricky obstacle....
FetteredChinos
Veteren member
- Messages
- 3,897
- Likes
- 40
looks like its up we go 🙂
tradesmart
Experienced member
- Messages
- 1,286
- Likes
- 22
It's hit the top line of that 'expanding triangle' which is reckoned to be bearish..
but do the bulls know that........?!............ 😕
I see the Naz has completed its mission to fill the opening gap created by the drop yesterday - now showing an ND rsi top so that could be meaningful........
but do the bulls know that........?!............ 😕
I see the Naz has completed its mission to fill the opening gap created by the drop yesterday - now showing an ND rsi top so that could be meaningful........
Attachments
FetteredChinos
Veteren member
- Messages
- 3,897
- Likes
- 40
shh. dont say that.
thing is, it would have to break 10,260 on the way down again..
Philly at 5pm today.. oo-err...
thing is, it would have to break 10,260 on the way down again..
Philly at 5pm today.. oo-err...
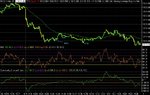
The pullback at A was a good entry for the three step up move at the start which also finished bang on the top line of the expanding triangle on the 10 min chart.
Divergence at B & C if you fancy playing the swing trades.
The triangle break at D had a target of around 32 and delivered nicely.
Chartman - a quick question for you if you don't mind? At the open we had a 3 step up move then near the end of the day we had a 3 step down move from 275 to 232. How do you know whether there will be 3 steps or the 5 steps we sometimes get?
Hope everyone did well today!
EDIT - the attached chart is slightly wrong, the top line of the triangle that broke at 19:13GMT should be drawn at 275 not where it is, I must have dragged it by accident but it's close enough!
Justyn.
Attachments
Last edited:
The 10 min chart showing the expanding triangle.
Could the base line of the triangle be horizontal at 238 instead being a descending line? This has been offering support for some time as you can see.
If 238 breaks tomorrow then will we hit the descending line which would be at 215 or lower depending on the time of day?
And if expanding triangles are bearish does this mean we could break through this line and maybe see 200 and lower?
I guess we'll see tomorrow, I'll probably be completely wrong as usual!
Justyn.
Attachments
Bill
Active member
- Messages
- 160
- Likes
- 1
Hi
Not much to say today. Attatched chart speaks for itself.
-2 on the day but could have been a lot worse. 🙁
I thought witching week was supposed to be volatile?
Regrads
Bill
+-15 ema Rules are
1. Short if price crosses 100ema and touches/crosses 100ema+15
2. Long if price crosses 100ema and touches 100ema-15.
3. Short if nd and/or price is 100ema +15 [or v close]
4. Long if pd and/or price is 100ema -15 [or v close]
5. Don't trade in the 1st hour
6. Stop losses above/below obvious SR
Attachments
16/09/2004
Hi,
I don't know how the regulars manage to account their trades and post them, religiously every day. Respect to them🙂
I can't do it, so I've decided to do it once a week, probably a Thursday.
Held 7 short positions over last weekend. I admitted at the time that I got carried away, really should have only got in to 3 or 4 positions. Anyway, the wave counts were right for topping and after an inverted saucer on Monday, the rest was down to that rapid decline on Tuesday PM.
Felt very overexposed with the shorts, so closed them sequentially at 278 and 270. SHOULD have held onto them longer for huge profit but misread the wave count. I'd counted a 5 wave down but that total was basically only a bigger degree wave 3, so silly me, wave 5 down followed for another 40 points missed. Got +27 points, but too much risk for not enough reward.
Started going long from when I thought the 5 wave series was finished but of course you can never get these things exactly right; and so started at the 2 of 5, repeated on 4 of 5 and finally got it right with a 3rd long at the bottom of 5 of 5. This whole decline was either an impulsive wave down (so plenty more to come) or it was a C wave (so reversal up expected). Either way some sort of reversal was due, hence the longs. Closed them after a beautiful 3/3/5 abc reversal for -15,+6,+18,+8. Reversed almost immediately to short and closed at +30 very quickly. I don't mind keeping positions for a few days or so, but if God gives me a quick profit, I'm happy to take it🙂 Wasn't happy going long after this, because I believe the wave count best favours a big drop coming up. However, the market played sods law and promptly went up. It was clear that the first abc was an A wave, the drop was a B wave and here we were with a C wave. Overall this was another, bigger 3/3/5 pattern, so another retrace pattern finishing. Started shorting around the 38% fib retrace and added in a second short after the peak. Right up against the upper trend line of channel from last Monday, so seemed a good place with logical stop placement. The market never really took off and although the channel was just broken, there was no follow through. Was happy to close these shorts for +29 and +39 later today.
Where from here? I'm out of the market now, which is unusual🙂
It looks like this consolidation on the low (?4th wave, ?B wave) has more to go, so could easily go back to 10300 or so with an c wave. I'm sure the whole thing IS corrective because the 10min ADX has dropped from the Wednesday morning low at 10240.
I'm going to stand back a little now. If we get to the 10280 / 10330 range, I'll short quite heavily.
Results for the week; ...
Monday 0, Tuesday 0, Wednesday +47, Thursday +68.
Good luck to everyone.
Attachments
Last edited: