You are using an out of date browser. It may not display this or other websites correctly.
You should upgrade or use an alternative browser.
You should upgrade or use an alternative browser.
TraderTony
Active member
- Messages
- 180
- Likes
- 1
Monday 13th September 2004
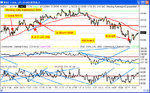
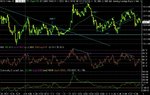
9:49 First pullback to 100 ema but after no convincing early action and possible triple ND (going back to Friday's action).
9:57 TRADE ENTRY: Long 10312. Took a risk on second move up off 100 ema after a TLB on RSI. Jumped straight into loss though. Had another attempt up breaking larger TL from Friday. ES pushed up a couple of times but YM seems extremely reluctant to join in. Hit new highs but no momentum and a really struggle to take out 32. Which it fails to do on two attempts, with ND (RSI) on second.
10:47 Moved stopped to b/e +1 on third run up after this earlier failure at 32 and ND - absolutely no upside conviction.
10:52 TRADE EXIT: Stopped for +1 - right at lowest tick of the move. Now watch it turn back up and soar. Can you believe it. This exit was through fear and it was far too early.
11:02 Up to new highs but stalls at 33. Not a clean three peak ND but lots of ND around none-the-less. But it keeps creeping up and up and up - very odd. I should have at least waited for TL under lows to be broken before exiting as per CM's comments this morning.
11:06 TRADE ENTRY: Short at 10326 on the failure again at 32, lack of upside momentum, divergences, and TLB on RSI/CCI. In far too soon as it keeps on up to new highs (albeit with more divergences). I am not convinced by the upside at still l but clearly I should still be long, not short. Will hold a bit longer now I'm here (subject to hard stop) as a break down still looks very likely to me.
13:37 After continuing a painfully slow creep up it drops below the 100 ema and 32 level but certainly not a downtrend yet. Bounces off triple PD/320 level (only over 20 minutes). And another drop held up by 320 level.
14:39 Drops below 320 but no follow through yet - ES and YM back at Friday's HOD. And springs back up again.
15:09 Breaks down to new lows but potential triple PD forming.
15:37 TRADE EXIT: +25. Closed in last 30 minutes on possible reversal at 300 level.
+26 from 2
-24 for September so far
Attachments
Pants is the one word that sums up my opinion of today.
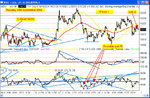
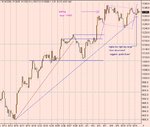
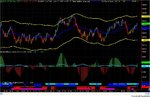
Futures were at 332 just before the open so I was looking out for either a bounce down off 332 at the open or for it to break through and maybe pull back to it. I took the failure to reach 332 at point A with the second lower peak as a signal to go short. Didn't work out and I got out for -5, my only trade today.
I suppose the best entry points in the morning were at B where it bounced off a previous support point or at C where it bounced off the EMA.
Point D looked like a 3 pk nd but I wasn't convinced. Point E also looked the same but then we had the HOD at F.
A similar story at point G and I think I gave up caring after that!
A disapointing narrow range again and a boring day watching a 1 min chart go nowhere fast with signals I had no faith in.
Here's hoping tomorrow is more exciting!
Justyn.
Attachments
Bill
Active member
- Messages
- 160
- Likes
- 1
The experiment continues............
Hi
Back from my hols in very sunny Coniston. 😎
OK today +16. Suitable for the +-15 rules so I've annotated the trades on the chart.
Comment
Closing half the trade when the price hits the 100ema line and rolling the stop to BE seems to be working. If the price reverses after it hits100ema then I get a small profit and protect myself from a loss. The safety net worked very well for the final trade.
There was a potential long in the last hour but I'm reluctant to open a new position so late in the day..... I'll have to cosider that a bit more 😕
If the enry/exit values look a bit on the high side that is because the Capital spreads simulator seemed to be quoting a few point higher than everyone else today.
Looking back there was some very interesting stuff from last week. This thread is really going well. Thanks to all contributors and in particular TT
Regards
Bill 🙂
+-15 ema Rules are
1. Short if price crosses 100ema and touches/crosses 100ema+15
2. Long if price crosses 100ema and touches 100ema-15.
3. Short if nd and/or price is 100ema +15 [or v close]
4. Long if pd and/or price is 100ema -15 [or v close]
5. Don't trade in the 1st hour
6. Stop losses above/below obvious SR
Attachments
Awful day, by the looks. Short time span divergences all over the place.
To add to your tools, ( if you have Sierra) look at the 150 Least Squares Moving Average ( top left yellow MA line. I heave used it a few time to resolve issues. Today is a good example, in slowly moving markets. It shows a clear crossover from up trend to down trend. OK It's late, but it's telling you something.... No doubt there are plenty of other indicators that will do the same. There are those that use no indicators, those that use evy indicator under the sun and those that use just a couple. I subscribe to the last ( my brain can't count higher than two being totally indoctrinated by binary from an early age :cheesy: )
You can use it in two ways- one is to give confidence in a fast move where you take the trade as the price goes through the LSMA or like today, where the 100EMA and the LSMA cross to switch direction. Be sure you understand how it works before you start to trade on it......
No help today from 332...... 😱
Attachments
TraderTony
Active member
- Messages
- 180
- Likes
- 1
Tuesday 14th September 2004
Looking at daily average true range (10 day) on DJ index on my charting service this morning showed it currently at 126 - the lowest since 1997 (when the data starts). The highest peaks are at about 500 and for about 4 years between mid 99 and mid 03 it never dropped below 200. These narrow ranges are just not normal by the standards of recent years (which is not to say they will open up any time soon).
Today was tough and I missed one decent exit for a small profit...
9:34 TRADE ENTRY: Short at 10313 on CCI and RSI TLB off 100 ema. Risky early entry with gap likely to close. Runs straight into large loss. Popped down to take out opening lows then stalled above crucial 300 level. Never made 300 let alone yesterday's LOD (234 - which will also be at the channel low on 10m chart if challenged this morning) despite repeated moves down before heading up wards again. Just stuck in a tight formation below the 100 ema. NASDAQ seems to be breaking up and pulling DJ with it.
10:47 Another break down but fails to reach 300 level again. Looking at indicators suggests next break now will be to upside when resistance trend line breaks. Yep - up it goes and breaks out of triangle with some volume. If T1 reached (around 10335) I will be stopped out. Paused just outside upper channel line then started to move up but no obvious momentum this way either. Down again but it will not break below 303. About 6 bounces so far today.
11:59 Another push to the upside and this one breaks through with substantial volume. Frustrating as being short has never really looked wrong before with a big downside break looking imminent. New HOD on NQ. How depressing.
12:10 New HOD
12:13 Should have exited at 100 ema +21 but prices froze on IB until prices were back below 32. Decided to take risk and manage trade whilst below 32 as could just be a spike.
12:53 Stubbornly held on the next time it moved up through 32 as still not convinced by upside action and big potential divergence developing on indicators. Hard stop remains at -35 and this is a gamble that I probably shouldn't be taking.
13:17 Drops to 100 ema and stalls. If it moves back now I'm buggered as I'll miss the long opportunity as well as racking up losses. Next move pulls it below but now heavily O/S. Bounces off 315 with possible TLB on CCI. Keeps on down to earlier support channel then bounces hard off 308 with PD on RSI. 10 m chart has CCI right on support line going back to Friday's opening. A drop here would be interesting.... instead it springs back up. Downside seems to have dried right up. Close to lots of support levels.
14:00 Potential triple PD on second failure at 308 but could be a bear flag. But it's breaking back up, albeit using a huge amount of RSI. That support above 300 is sooooo strong. Will break as soon as I give up on this short. Stalls at 100 ema before another push down. Pauses short of lows. Cannot get the big push down despite all the stops under 300! And up it goes. I can't believe this - everything says down to me. Trend line forming on RSI which could break to the downside. Back above 100 ema and getting hammered. How I should have taken the PD. It's going back up the the highs. What a complete mess up.
14:31 TL breaks to downside on RSI but down move quickly runs out of steam. Agonising. Pushes again but cannot reach lows. Extraordinary support. What is holding this thing? Up it springs again. Just don't know what to do here. ES strong and pulling up wards. Another run down. Bounces off 307! Unbelievable. Then off 305. Big divergence on RSI.
14:52 More failed attempts and up it surges straight through 100 ema.
15:43 Late drop at last after triple ND on RSI - but still inside the day's range. Again no follow through.
TRADE EXIT: At close -5
-5 from 1.
-31 for September so far
Attachments
Bill
Active member
- Messages
- 160
- Likes
- 1
Hi
Another suitable day for the +-15ema rules. I was a bit of a wimp today since I only took half size trades expecting a a break from the current range. I've annotated the trades on the chart but also notice the black lines showing CM's old lower channel and new upper channel. The new one worked well as resistance today. Nice one CM!
Total was +10 [+20 if I'd used full size trades.]
I missed a short at B cos I fell asleep in my chair. Hard day at the coal-face you know 😱 ....must get a less comfortable chair....
Regards
Bill 🙂
+-15 ema Rules are
1. Short if price crosses 100ema and touches/crosses 100ema+15
2. Long if price crosses 100ema and touches 100ema-15.
3. Short if nd and/or price is 100ema +15 [or v close]
4. Long if pd and/or price is 100ema -15 [or v close]
5. Don't trade in the 1st hour
6. Stop losses above/below obvious SR
Attachments
Last edited:
TraderTony
Active member
- Messages
- 180
- Likes
- 1
Good trading Bill - I really like your approach for these narrow ranges.
Another difficult day with a range of just 35 points.
The triangle break at A delivered its target.
Divergence over 2 peaks at B seemed to be the only clue that we were heading back down to 305 again.
Divergence at C with exit at D the only other opportunity I saw today but if you are using SB then once you have seen the signals have developed for sure you would be lucky to make 20 points.
Justyn.
Attachments
OK so we haven't lost support and the temptation to drop into a down channel has held off. I feel a move coming on....there's a 100 points in that triangle formation, so get ready to jump on... adn just remember what the target is- 100 points from the break. So 425 up, or 225 dow. Why bother guessing which way? You'll know soon enough. Just make sure your plan is in place.Res. is bang on 332 and support is 310..... I wouldn't be too keen taking a short at 310 because of the support across 300 so maybe 295? Conversely, at 332, you'll have to watch 350 as resistance but you're more likely to get the move going to 364.IF it goes, it should give some nice targets on the way with a 100 point move. On the other hand, nothing may happen. 😱
Attachments
Another really tough day, with the only break already noted as the triangle break off the open. OK so we had some divergences to take on, but they led to nothing significant.The move to T1 looked like it could go far, but fizzled out as quick as it took off. That's life.....
Attachments
Didnt trade yesterday and by all accounts didn't miss much either.
2 trades today first was a short at pull back to 100ema, (taken out of boredom as well) not advisable!!!! price soared skywards very shortly afterwards which was an expensive way to give away 20 pts when my stop was hit.
2nd entry was off the nd In hindsight i could have taken it further up but waited for 332 to break and exited on third peak pd. giving +17.
Didnt take the last nd as i wasnt sure if it was just a stall @ 32 or not.
so overall -3 for the day.
Also over 26 ppl in the chatroom today which was good to see.
Attachments
bansir
Well-known member
- Messages
- 494
- Likes
- 42
ChartMan said:OK so we haven't lost support and the temptation to drop into a down channel has held off. I feel a move coming on....there's a 100 points in that triangle formation, so get ready to jump on... adn just remember what the target is- 100 points from the break. So 425 up, or 225 dow. Why bother guessing which way? You'll know soon enough. Just make sure your plan is in place.Res. is bang on 332 and support is 310..... I wouldn't be too keen taking a short at 310 because of the support across 300 so maybe 295? Conversely, at 332, you'll have to watch 350 as resistance but you're more likely to get the move going to 364.IF it goes, it should give some nice targets on the way with a 100 point move. On the other hand, nothing may happen. 😱
Hi CM,
My chart suggests upside looks favourite (but this comment is probably the k.o.d.) 😆
I'm sat on the sidelines and only paper trading.
If trendline holds and the upper bull flag channel line breaks to give a pull back oppertunity, I may consider
taking a long. Not that I'm cautious or anything.. :cheesy:
cheers,
neil
Attachments
Last edited:
Noone seems to have mentioned the completed bull flag on the EOD DJ chart since Feb.
Pat494 I will have a look for the flag you mentioned, thanks for pointing it out.
This thread is more about intraday trading so although the long term view is always of interest it probably isn't so relevant to the people trying to make one or more trades every day.
Cheers!
Justyn.
Pat494 said:Noone seems to have mentioned the completed bull flag on the EOD DJ chart since Feb. :-0
Agreed, though I thought I was pushing "long term" by looking at the hourlies.🙂
Quoting from others, considerably more experienced than me. Their general view is that we've got another 3 months or so before this "bull flag" is finished.
It's bad enough trying to see day to day patterns and trade them. Like the weather, the further forward you look, the less accurate you are.
Regards,