T
triplepack
Trader Tony
I look forward to your analysis each day Tony . Keep it up mate well done.
Triplepack
I look forward to your analysis each day Tony . Keep it up mate well done.
Triplepack
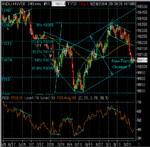
justyn said:Any expanding triangle experts out there who can tell me if I am talking nonsense?
TTony.....
23rd September 2004
To accommodate the potential higher number of shorter trades I am now taking, I am going to enter and automatic hard stop of 10 points as opposed to the 35 I have been using.
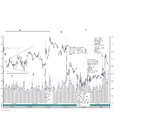
That means 100- 200 point drop ..... Alternative scenario is that it develops into a "W" bottom.
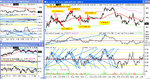
So you're saying we could be heading down, or we could be heading up?