Dow Intraday Charts 01 Jun - 04 Jun

CM,

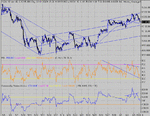
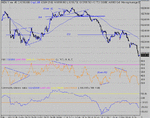
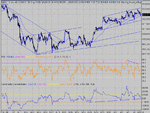
I interpreted the loitering at 32 as a bull flag, even though I bailed. (I was even going to post a message saying BFon 1 minute/ 5 min with target of 255!). I SB and their prices always seem too quick to drop when you're long. When the real price hit a new high at 41 ish the SB price was still hovering around 32-37 with not much movement. I have held at moments like this before and got caught out with sudden massive drops.

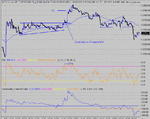
I know you SB too, but whose prices do you believe? I have often looked at the 'real' value and the 'real' charts, but the SB price seems to know in advance of the direction. Today I got the feeling that they 'thought' it was going to tank and so got spooked, but typically the reverse happened.

Do you ever rely on the SB price or do you ignor it until the last minute?? For reference, I always use either 'bigcharts.com' or 'prophet.net' for my 'real' data.

Kind regards

joffliver
 
That's a problem. I get round it by using realtime Dow data and ES futures data. The Dow gives me the TA action and the ES gives me the futures action, more or less. The dow charts are always going to lag behind what the SB price is. So I plan a move/action etc.off the Dow cash chart and execute it ( or hold off ) using the ES futures chart, knowing the SB price will more closely follow this. I tried Dow futures charts, but found them far too spikey!!! This is one of the reasons you find the SB price real twitchy at times......
As for when it comes to hitting the button, it pays to wait a bit... being too hasty as it goes against you ( or as it appears to ) is bad news. You get hit because the futures have , say , a spike mid period and the SB price flies off, resulting in panic... just hold off a tick. :cheesy: Look at candles if you aren't already.( or OHLC) . Cross reference the spikes in the tails ( or tops) and cross correlate that to the SB price and watch it expand!!!
Around 32 and 64 ( and 00's ) is not a place to close a position. It's a decision point , so wait until it's decided...You were spot on with the bull flag at 32.
The exception... if you have a planned exit, such as the 3rd peak on an expected 3 pk ND top, that's the time to track the SB price. Follow it like a hawk, as it should be ahead of the cash price..... the first sign on a spike at the appropriate time may give you an out at the very, very top and the best SB price, before it turns around and goes 10- 15 points to the bad.
 
CM.

I was looking back over some of your previous threads and came across one dd 5/2001, it involved trading the index around a 7 day MA, checking it against the current 6mth daily chart it threw up some very profitable trades. You said that whipsaws were a problem and to get around this you mentioned using TA, do you agree that using the DMI indicator would be the ideal ? Using your experience gained since then is there anything you would add to your system?

Do you agree that a bull flag has formed from 3pm(US) on the 1min/5min chart yesterday? if so I would expect a rise to the 360 area.

I am impressed by the quality of your charts, could you please give me the details?

eddyjo.
 
I can't find the thread to which you are referring . Can you copy the thread ID and post it? I think I know what it was about.... a method of mechanical trading EOD dow...
I think right now, any method/system would have done well over the last 6 months, so take care!.
I've never used DMI so I can't comment on how it would do.....
I agree about the bull flag, but the target looks to have failed now.
Charts are from Sierra.com with MyTrack data feed. Sierra do a 1 month free trial ( I think) and you can buy a subscription through T2W....
 
Hi CM,

I find your useage of rsi very interesting using the pd and nd's for the turns. I've read Constance Brown and her use of RSI , but with Andrew Cardwell's negative reversals ( hidden div.), I find her price targets using this technique very intrigueing. I wonder , have you used or had any experience with this use of rsi.
I've tried to find other papers on this but only on NQoos site but he used it only as a continuation signal not for price targets. Andrew Cardwell was in the middle of writing a book on it and other uses of RSi but pulled it before publication.

I'd be interested in what your thoughts on this is.

Cheers

Richard
 
Long time no see..... 4 channel lines.... Looks like 305/350 is gone for now. The RS Switch is holding on both price and RSI and with the latter at 30, it's close to O/S, but could drop to 20.... Support at 165/175 will be critical if we're going to carry on the mini up move.
 

Attachments

  • dow 03-06-04 10.gif
    dow 03-06-04 10.gif
    38.7 KB · Views: 220
I will go back and try and find it, I printed it out so if you have a fax I could send it that way
 
Long off the open PD proved good today, but as always, beware of doing this.! The break through the RSI triangle helped confirm... with an out on the ND top. Not the top top, but as is often the case, only a few points off HOD.... Absolutely no point in worrying about that. Always take the 3rd peak and you'll never be far off..... Perfect example of how to calculate where the third peak will be. The first was at 16:40, the second at 17:00 so expect the third at 17:20. It came at 17:22. Not always this precise, but if it is, bank it!
Next entry.... the ND rise made a nice channel which pulled back to resistance soon after the break ( @ 274) so should have made you thinking short... confirmed aas the 100MA and 264 went, with an out on 220 PD over 25 mins. In this case, the 3 dips were no where near equi-spaced.... Not the best exit in hind sight. Maybe a good case in point of take what's given and leave the rest. If you have the patience to wait for the setups, take the proven exits, why gamble on what's inthe middle? Hard to do, I know.
 

Attachments

  • dow 03-06-04 1.gif
    dow 03-06-04 1.gif
    27.2 KB · Views: 277
Sierra is quite easy to use. Just keep it simple. Or if you are a wizz kidd , you can write your own " studies" ( indicators,alerts etc.)
 
TriplePack- I've not heard of either of those people, or their RSI methods......

Eddyjo I never developed that system further and have long since moved away from AIQ charting package, although all the testing was done using historic data and Excel spreadsheet. Not being too smart at Excel,I couldn't get on todevelop the system further...... As I said earlier, almost anything mechanical would have produced good results over the last 6- 12 months......
 
Channel resistance/support now look spot on, giving a good turning point today at 300. Looks like the price has come off support after the RS Switch...
 

Attachments

  • dow 04-06-04 10.gif
    dow 04-06-04 10.gif
    40.6 KB · Views: 285
Interesting point on adding to a position.... Taking the break of the triangle, where you would take a long, as the price pulled back to 64 and went off through 70 ( higher high) that's the place to add to your stake. The risk? The loss of 64, and then the loss of 60 , so 10 points, ish. Having previously tested 64 three times, to me, the break was a "safe bet". All well and good, but you need to offload one stake at the first sign of weakness- in this case as RSI hit 80- well O/B. Final off load at the 3rd peak ( Bump top ND),just on 24 minutes as RSI dropped to 76. When adding, remember that your losses come in twice as fast( or more!), including not getting out at the top......
 

Attachments

  • dow 04-06-04 1.gif
    dow 04-06-04 1.gif
    24.5 KB · Views: 320
Top