Dow Intraday Charts 27 Sept - 01 Oct

Love it when a plan comes together... :cool:

Home just after 5:00 to see what looked like positive sentiment. On up days we look for buying opportunities and don't use the rules. Took the bounce from ema which moved into profit then dropped. Didn.t this happen yesterday in reverse?

Anyway things started to move down/sideways and I decided that the rule 2 long at B was a good move. Moved the stop for A down as well [bad boy !]. It all came good with the exit(s) at C & D just as I planned (ahem! ;) )

Notice how the price bounces off the outside of 100ema +15 up till 5 o' clock.

+23 today

For the week: -8,-46,+51,+4,+23 = +24 which is OK but not enough to quit the day job but we live in hopes eh?


'Bon weekend' as they say in France

Bill :)


+-15 ema Rules are

1. Short if price crosses 100ema and touches/crosses 100ema+15
2. Long if price crosses 100ema and touches 100ema-15.
3. Short if nd and price is 100ema +15 [or v close]
4. Long if pd and price is 100ema -15 [or v close]
5. Don't trade in the 1st hour
6. Stop losses above/below obvious SR
7. Don't open a trade in the last hour

Edit: Corrected an error at close C & D. Sorry.
 

Attachments

  • dow_011004.gif
    dow_011004.gif
    37.7 KB · Views: 215
Last edited:
Hugely frustrating day for me - one that was over almost before it began and I missed the ride....

9:38 Passed on first entry long on TLB up as numbers due at 9:45 and 10:00 but it was a cracker and would have been a wonderful 20ish points to start the day. Likewise the next one at 9:56. Flip. Would have been closed at about +24 minimum this time on TLB back down at 10:07. Coulda shoulda woulda been up 44 points or more after barely 30 minutes. That would have been tasty. It will instead be very painful if the day goes badly from now on.

After all that action it inevitable goes completely flat while I look to get into a trade.

10:42 1) L 162 but no follow through.
10:44 EXIT -4. This has a horrible inevitability to it. I missed the party - the action now will be for suckers.

10:48 2) L 10159 which takes a while to move then runs a little.
10:55 EXIT +9 (plus 1 at +3, 1 at +6).

11:00 3) L 10172 on another gentle push up.
11:04 EXIT +2 (plus 1 at +3, 1 at +6).

11:10 4) L 10168 but this is just flat now.
11:15 EXIT -3 (plus 1 at +3)

OK - I think that's enough for a while - there is no follow through anywhere now. The big question for me is whether I should have taken the earlier trades now I'm using a more aggressive style. They were absolutely clear entries except for knowing the news releases were imminent. Of course, the numbers could easily have gone against me, but on the first at least it was already well into profit before they were released. Over caution has been very very costly today but I guess I'll have to get a better feel for this over time.

Haven't missed much so hoping for action after 13:50.

13:56 5) S 10157. TLB down after hanging just below 100 ema. Right above the lows of the channel it has been stuck in since the early rise. Run nicely to +6 and retraced.
14:04 Exit +3 (plus 1 at +3 and 1 at +6). Exit on RSI hook up with divergence as price hooks back into channel. Still no movement.

Continues to creep down so exit a bit premature but still really laboured.

14:20 6) S 10152. TLB down. Never moved 1 tick in my favour. Well, I did have a feeling about today.
14:23 EXIT -5.

This could turn into a banging-my-head-against-the-wall end to the week. Reckon they all went home after this morning's race up.

Well, just maybe that was the bottom - after the failure it has taken off back up over the 100 ema with some clear strength and volume.

14:45 7) L 10173. Possible break out of bull flag with T1 around 85. No follow through.
14:48 EXIT b/e (plus 1 at +3). Out too soon.

14:51 8) L 10179. Same trade at 7 but now at a much worse price. Up nicely to new HOD and boom - back to entry and out.
14:54 EXIT b/e (plus 1 at +3). This is really painful stuff. Of course, it did eventually hit 85, the T1!

15:27 9) L 10178. Going no where and reverses sharply. It was a bear flag.
15:30 EXIT -5.

Then, after three consecutive failed longs, a strong run up to the close to make new highs. But it's too late for me.

I feel I've been someone's lunch today. Missing the big moves then making entries right before a channel test or HOD or something like that.

-3 from 9 for the main runner.
+4 from 9 for the 3's
+1 from 9 for the 6's

All losers after commission (-12, -5, -8 respectively).

This month I'll record the final figures for the main runner AFTER taking off 1 point per trade for commission, giving...

-12 for the day after commission
-12 for October
 

Attachments

  • 20041001.jpg
    20041001.jpg
    333.9 KB · Views: 194
Good comments again guys.... Channel in full swing now and looks like I correctly guessed last night. There's a little more room to move up following the consolidation and the drop in the indicators.Substantial buying into the close on ES suggests more to come as well.
 

Attachments

  • dow 01-10-04 10.gif
    dow 01-10-04 10.gif
    39.2 KB · Views: 230
Easy start ( if you had the sphericals) and a nice ride up.Not too much difference between the first 3k ND and the second one, so no excuses for not getting out near the top.Note holding on to the first one supported by the long distance from the support line drawn of f the first two lows.( mentioned before).I'm not sure whether this will pay dividends in the long run or not....Probably on SB, probably not on Direct.,given the the following rise would usually not be more than 20 odd points.Easy re-entry on Direct as the price went through 164.
Then a sideways consolidation drift for the rest of the day, making profits hard either way, but with minimum risk taking on the 100MA rules.....
 

Attachments

  • dow 01-10-04 1.gif
    dow 01-10-04 1.gif
    25.6 KB · Views: 204
Trader Tony
It seems youre well on the way, but a couple of comments if I may.... You have on your charts, the +/- 20 ( or 15) lines which should help.
Your short at 6) seems to ignore what RSI is telling you.. there was a clear triangle setup here on RSI( did you miss it?)
Don't you find that all your TL's on RSI confuse the issue? With your style, from what I can see, you may be better off concentrating on a 5 min chart, given your enthusiasm for TLB's. Try before you buy though.!
 

Attachments

  • dow 01-10-04 5.gif
    dow 01-10-04 5.gif
    22.5 KB · Views: 185
CM - many thanks for the comments. I did miss the triangle - good spot. The TLBs have not intentionally become such a big deal, but I have started to find them extremely helpful. I expand the chart in real time so it is not quite a mess as it can look when I post, but I'll have a look at longer time frames over the weekend. One thing I'm pleased about is the losses remain small while when there is movement in the market I am getting winners to run. I'm finding this quite an enjoyable way to trade too, albeit for the frustrations when there just isn't any range.

What chance a breakout of the 9 or 10 month channel on the dailies next week? That might liven things up a little!

Wishing everyone a good weekend.
 
Hi TTony - I'm glad it's coming together for you.....!

I remember you saying that you were using the Ninja Trader frontend with IB.....

How are you finding it compared with the standard IB TWS setup....?

Regards
 
Interesting question TS, and I'll give a personal perspective from the opposite end, as I've been using Ninja for almost nine months now. Until SP2 that is! :rolleyes:
Thanks to SP2 I am unable to install the .net framework, and so am unable to load ninja! This has been a long and harrowing two weeks for me and I've just decided to leave well alone now, as at least I have Sierra/IB up and running normally!
To cut a long story short I've been reduced to having to use TWS, which is something which gave me a lot of grief many months ago. I chose to use the book trader function, and to be honest I'm quite impressed with it. It seems to operate in a similar way to ninja, and you can choose to use stop or limit orders, which are ammended as you move them within the price framework. The only niggling doubt I have is that I'm sure the orders are just held locally with IB and are not native to the exchange, this therefore opens up some areas of risk which I intend to look into.
Anyway to sum up, I had a few problems to start with but now it all seems fine to me and at no cost!
So until I start to trade multiple contracts I think I'm going to exit ninja for now!
Cheers
Q
 
w/e 1/10/2004

Hi,
Interesting week. Thanks to this site, I'm now properly accounting my returns ... good discipline. So far, I've three weeks in total, using a mix of IB and SB. Just finished week 3, numbers are Dow points.

week 1 (+455 closed positions, nil carried over, net +455)
week 2 (+477 closed positions, 1007 carried over, net -560)
week 3 (+1066 closed positions, 237 carried over, net +829)

weekly average of +241.

I reported at the end of last week that I was carrying over losing long positions (1007). This week they were closed at profit, but not a lot.

On Monday, I didn't dare add in any more positions. I thought the bottom was hit around 9980 (using wave count, MA volume) but the risk of further exposure was too high. As I admitted at the time, I got in to longs too soon on the way down and actually overexposed. MISTAKE.

The retrace bounce came back up to 38% at 10140 by Wednesday and I was able to day-trade small positions on Monday / Tuesday. Normally I'd have closed at the retrace but stayed long, expecting a correction and another leg up. It came, but I was STUPID to risk it. It would have been far more profitable and less risky to get out at the 38% retrace and get back in when the pattern was confirmed as the B wave.

Now here's the really stupid part. I wonder if anyone else has had similar problems? I kept my longs till Friday, intending to start taking profit from 120 upwards. My first close was at 118, I intended to close half (which would have been 3 positions). The order slip on my SB automatically fills in the order amount with all the positions. Not the first time I've got this wrong, I didn't check the amount and closed ALL my longs. I've had similar difficulty when I've sold instead of buying ... all because, in the heat of the moment I don't check the order tab. CRAZY.

Bugger me, if I didn't get the IB ticker wrong as well. I'd filled in the full amount "just in case" the market topped and when I decided to take half profit (2 positions), I didn't alter the preset and closed them all. Aaaaaaaaargh. Of course, the market shot up. I can't explain the anguish of watching what "would have happened" to all my lovely longs. SAD.

Anyway a profit is a profit but I wasn't a happy bunny.

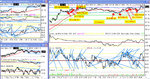
Back to the market ...... we're just under the 62% retrace (10205 to 10210) and I'm back in with shorts from 150 upwards. Got plenty of ammunition left if the market decides to go further up; there's considerable resistance here but IF we break to the upside, 10300 is not expected to be taken out (well, according to EW anyway:)).

There was a very large resistive volume surge at the end of the day on Friday and throughout the day, much more resistive volume was collected. Of course, we might get another push-up but we will respond to the resistive volume soon (with a price drop).

The wave count suggests that we're in the final stages of a corrective ABC from the 9980 lows; probably C4. If I'm completely wrong, we're in wave 4 of a 5 wave impulse from the 9980 lows. The impulse channel would need a hit around 10140 or 10150 to finish the fourth wave, in that case and we would be looking for 4c to do it.

It seems to me, that which ever way I look at it, there's a chance of some sort of further push, but we might just have finished an ABC where A=C, a common relationship.

I'm happy to stay short and add in more IF we climb; and will review around 10140 as nearest support, possibly with a retest of the 9980 lows thereafter.

Sorry there's no chart this week. Next week I must remember ... mistake, stupid, crazy and sad. It might encourage me to be more careful:)

Have a nice weekend and good luck to everyone next week.

Regards,

Graham
 
Last edited:
I'm not a happy bunny.
Been taking 15-35 ticks all week.
Set up a SB on Thursday with a limit sell and yet again was too cautious.
I must try to read more accurately the rise probabilities.
This is doubly silly because for several weeks I had had my limits within a few points of where the market peaked :rolleyes:
 
Tradesmart -

Yes I do use Ninja and find it very good. I probably only use it to a fraction of its capabilities but everytime I enter a position it fires off an automatic stop and a selection of targets. I can change any of these with one click of the mouse and as soon as a position is closed, all the other orders and automatically cancelled. To me that is invaluable and I would hate to use the normal TWS again - I have made too many errors in the past. Having said that, I think there are a number of 'front ends' that do a similar job. A tried a couple out a year or so ago and found Ninja the easiest to use and have just stuck with it ever since.
 
Thanks TTony - I'm testing the NT demo at the mo' and agree that it's very user friendly.......

and thanks for your insight, Quercus.......

Regards
 
Top