Dow Intraday Charts 27 Sept - 01 Oct

Chartman

Point A in your chart is a Bear flag

I must be missing some basic TA here. I thought the flag was a bull flag if the flagpole was formed by the price moving upwards?

No ideas regarding a triangle on CCI, didn't see that one. I noticed (too late now) an ascending flat top triangle on the 10 min chart with target 10160. Should have held that long at the end of the day, Oh well.

Justyn.
 
Self explanatory 1 min chart..... Ran out of time to make T2 but it should go tomorrow, but as on yesterday's chart, there needs to be a recovery from RSI and CCI O/B without a price crash to continue.
Trendie, ( and others) you should seriously get a grip on these stop sizes. 20 points will cover most trading days, with big moves needing 30 points. Beyond that you have to accept that you are wrong.Get that bit sorted and the rest will drop into place.Unless your style is the big position/swings AND you have deep pockets, it can only end in an empty back balance. Sorry to be harsh.
 

Attachments

  • dow 29-09-04 1.gif
    dow 29-09-04 1.gif
    26.8 KB · Views: 265
TS
The wall is modular and built out of 8x4 GRP panels. Theoretically, there is no limit to the overall size.For a 32ft high x 8 ft wide wall, you would be hooked to a self locking safety harness attached to the top of the wall. For an 8' high wall, ther's no need as the climb is done "sideways".... can still hurt when you slip and fall though! :cheesy:
 
Obviously a brilliant concept CM, and I imagine that most traders on T2W will be ordering one for a pre/post trading work out……!

I fancy the 32 footer, but I think I’ll order mine with a large safety cushion as well as the harness……

I'll need a few years to train for the Beijing Olympics......... ;)
 
anything special happening today ??

the Dow is at 10,064-69 on D4F pre-open.
 
3 lots of news out at 8:30 ET - the price started dropping at 8:15 ET though.
 
With the high ( so far ) being higher than yesterdays high, and the low ( so far ) being lower than yesterdays, this is forming a engulfing cloud-cover ?? ( bearish ).

I also think that this outside day could become a "key reversal" day ??
What are the conditions of a key reversal ?
( is it higher than y-days high, and closing below y-days close, or y-days low ? )

early days till 9pm , I know.
 
Hi

Bit of an anticlimax after yesterday.

Home after 5:00pm to see what looked like negative sentiment. The price had been bouncing under the 100ema. So the rules should be no use. Negative sentiment means look for shorting opportunities.

A looked a possibility but I was never sure and took a half trade and rolled the SL to BE as soon as it went into profit. Sure enough it got taken. Still not convinced I took another short but now using the rules.

The other half of the short was in fact the best opportunity of the day with strong ND and rule 1 met. My confidence by this time was gone and I was very relieved to get 4 points out of the trade but of course if I'd stuck to the rules I'd have been [virtual] quids in. :eek:

No complaints though +4 for the day.

Looking back I think there was a long bull flag with target in the 90's. Now if I'd spotted that? Will wait for CM's post to see if that was correct.

Regards

Bill

+-15 ema Rules are

1. Short if price crosses 100ema and touches/crosses 100ema+15
2. Long if price crosses 100ema and touches 100ema-15.
3. Short if nd and price is 100ema +15 [or v close]
4. Long if pd and price is 100ema -15 [or v close]
5. Don't trade in the 1st hour
6. Stop losses above/below obvious SR
7. Don't open a trade in the last hour
 

Attachments

  • dow_300904.gif
    dow_300904.gif
    39 KB · Views: 218
Thursday 30th September 2004

I've done a little analysis on the most recent 5 trading days which is the period where I've been entering and exiting more aggressively. Far too soon to draw definitive conclusions but I noticed a few interesting points:

Total trades 40
Wins 18 for 158 (av. 8.8)
Losers 16 for -39 (av. -2.4)
B/e 6

This gives an average profit of just three points per trade, or two if one point is allowed for commission. However, this does give an average daily profit after commission of 16 points over the five days, which is not great, but not bad for me either. The margin between success and failure is very very tight though and therefore anything that can add a tick or two on average to each trade will make a big difference in the long term.

To that end, I also noticed that many of my losing trades and virtually all the break evens went a few points to the good before I exited. Because the average loser is currently just -2.4 I am going to experiment with some different targets today. I will take one off at +3 to see if, over time, this could be a low risk trade to cover some of the costs. I'll take a second off at +6, out of curiosity. I'll run the third as per normal. I'm also going to see how far each trade runs to the maximum point before I get an exit.


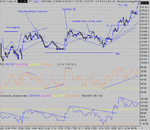
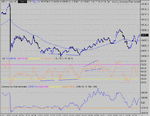
Weird opening - Dow futures down 80, Dow index barely changed. Somethings wrong. Whoosh, then suddenly the index is down too. Merck drug withdrawal.

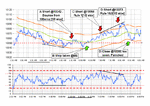
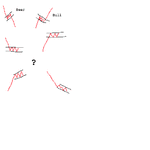
10:02 1) S 10061 on TLB down from below 100 ema but got a really late fill at bottom of two big down bars.
10:08 EXIT b/e (plus 1 at +3). Market seems strong despite big gap down.

10:17 2) S 10065 on next TLB down as still below 100 ema.
10:28 EXIT +4 (plus 1 at +3, 1 at +6).

Sideways in narrow range - will wait for a clear move. Doh - next TLB down at 10:30 was a winner (+3 and +6 both in the bag before TLB exit at +3).

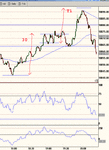
10:45 3) S 10062. Took the next TLB. Moved straight against me then back into the money.
10:51 EXIT +3 (plus 1 at +3, 1 at +6).

Too slow for next entry short at 10:54 which was a much better winner going all the way to LOD without any stress. Sods law. +3 and +6 would have been quickly in the bag. Exit would have been at 11:08 for +15.

11:33 4) S 10044. Moved nicely for +3 and +6 then pulled back to b/e. Then down again but bouncing off LOD.
11:42 EXIT +2. Leaving a double bottom with triple PD on RSI.

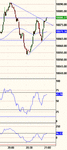
In view of that, and a feeling that lunchtime trades are not going to well for me, I'm going to stop trading for a while.

OK, I found that really tough but today at least it seems to have been a good decision. Market broke out of range at 13:30 then gave an excellent long signal on TLB after first pullback (around 10050) but I missed it (and there's the disadvantage!). Looking for longs now.

Really struggling to find a place to get back in. Perhaps the break was not a good idea for this reason alone.

14:17 5) L 10065. Chased a big bar after a TLB back up which is usually a really bad move. Never went into profit at all.
14:21 EXIT -4. No +3 this time.

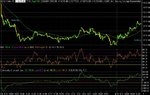
14:41 6) L 10052 on TLB after retrace to 100 ema. Took a while to get going then shot up.
15:02 EXIT +22 (plus 1 at +3, 1 at +6). Forced the exit a little and if I'd been braver I could have gone a bit higher.

Didn't get the reversal down so no more for me.

+32 from 6 today from runner, also +11 from 6 on the +3's and +20 from 6 on the +6's. So the core runner did best today but the +3's added a bit to cover costs and the +6's performed quite well. I'll keep this going for a few days to see how the results pan out.

+190 for September. Not bad but certainly not great. The second half was better than the first half. Let's hope October has a bit more movement.
 

Attachments

  • 20040930.jpg
    20040930.jpg
    333.6 KB · Views: 228
Good commentary, guys...Looks like we have a channel forming now. At least there are some guide lines in the sand.
 

Attachments

  • dow 30-09-04 10.gif
    dow 30-09-04 10.gif
    32.1 KB · Views: 224
Tough day with the best opportunity coming from the PD and DB at 40 .Or maybe a gamble at the open with RSI well O/S but that was due to the gap and I'vee seen them go on down from there.....
I can't see a bull flag, Bill.... Did you mean from the pullback to 64 at the 100MA?(19:41)
 

Attachments

  • dow 30-09-04 1.gif
    dow 30-09-04 1.gif
    22.7 KB · Views: 262
Chartman / Bill

There was a flag there IMO, I traded it at the time. (chart one attached)

I calculated T1 to be 10095 but it seemed to fail and pull back after the dbl top at 10075 so I got out for b/e before watching it arrive at T1.

Looked like a triangle breakout at the end of day (chart two attached) with target 10125 - I chanced a long from 64 (futures) and left a tight stop at 60 but got stopped out. Shame we ran out of time.

Justyn.
 

Attachments

  • chart.gif
    chart.gif
    14.5 KB · Views: 242
  • chart2.gif
    chart2.gif
    8.1 KB · Views: 214
trendie said:
The range today has been 50points - quite narrow.
Will todays 7pm move be in the same direction as yesterday ?

I am seriously in danger of wiping out my account after only 7 days - is this a record ?

Please someone say they have a bearish view, and its going to drop to 9,980 !!


Hi trendie,
You might want to consider lowering your stake size if your using long stops.
Imho if your over 30 pts out in a trade it usually means a bad entry and it's better to let your stop take you out or do it yourself earlier and look for another entry.

Carlos.
 
I've put up a couple of examples of a bear and bull flags that my be of help.
Though they can be hard to see as they occur.
What i look for is at the end of a pole is it in a channel if it's in a channel up @ the end of a down pole then i consider it a bear flag and vice versa.
My explanation is'nt very good but i'm sure Chartman will be able to explain better.

Carlos.
 

Attachments

  • chart.JPG
    chart.JPG
    150.8 KB · Views: 232
Hi Carlos,

those flag examples are clear and simple.

Could someone clarify what happens when the flag looks like the ones in the attached diagram? (Sorry for the poor quality artwork!)

There are two "flags" where the flag itself is horizontal and two flags where the flag itself is pointing in the same direction as the flag pole.

Cheers!

Justyn.
 

Attachments

  • chart.gif
    chart.gif
    2.5 KB · Views: 261
carlosd said:
Hi trendie,
You might want to consider lowering your stake size if your using long stops.
Imho if your over 30 pts out in a trade it usually means a bad entry and it's better to let your stop take you out or do it yourself earlier and look for another entry.

Carlos.

Hi carlos,

I was fine with 1 or 2 positions.
The problem I got myself in was entering boredom trades, increasing my exposure.

I could cope with the wide stops, but not with so many positions.
I need to learn to make my decisions, and switch my machine off.

I become transfixed with the screen during the day.
:)
 
hmm, mixed bag those last two , IMHO..


the former is generally super-bullish. and when it breaks north then it really motors, but then pulls back sharply... generally indicates a final push to a move IMHO.. may be able to whack a lowish-risk short in on negative divergance at the peak.

vice versa for the second one...super bearish.. usually about to spike down.

if they dont break in the direction of the existing move, then the move is generally quite weak..but dont take my word for it. just speaking from general observation.

FC
 
trendie said:
Hi carlos,

I was fine with 1 or 2 positions.
The problem I got myself in was entering boredom trades, increasing my exposure.

I could cope with the wide stops, but not with so many positions.
I need to learn to make my decisions, and switch my machine off.

I become transfixed with the screen during the day.
:)


The famous boredom trade (i've been guilty of it myself).
The curse of every account.
lol.
 
FetteredChinos thanks for your reply

hmm, mixed bag those last two , IMHO..

Any ideas with examples 3 & 4 where the flag is horizontal? Do you look at the direction of the flagpole - i.e. pole pointing down = bearish and vice versa?

Justyn.
 
the middle two just imply consolidation. they can break either way. but i think the general consensus is that the price leaves the consolidation in the direction it entered. ie, treat it as a normal bull/bear flag.


you need to look at volume to confirm a break though, otherwise you will get whipped to death...
 
Top