You are using an out of date browser. It may not display this or other websites correctly.
You should upgrade or use an alternative browser.
You should upgrade or use an alternative browser.
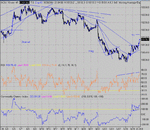
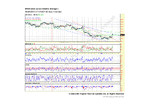
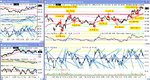
When is a channel not a channel? When it's a flag. Same shape, different time scale and size.Today is a Bear Flag. That means 100- 200 point drop depending on your viewpoint as to where the top of the pole is- 140 or 260..... Alternative scenario is that it develops into a "W" bottom.
Did I mention something about a "W" bottom a few posts back?..... Not out of the woods, though, as CCI and RSI are into OB. We need a drop on the indicators and no movement on price to move on up.
Attachments
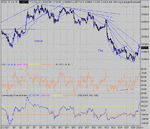
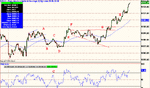
Pick the bits out of that. In the chat room I mentioned care was needed if you find yourself looking for shorts when the market only wants up. I can't put my finger on what it is that tells me it wants up, I just seem to know or recognise what's what. Certainly the first clue was that the first PD ( the one that dipped to 10,010) just didn't look right for a PD.Maybe the second clue was where RSI dipped to 50 without much dip in the price.
So a short at the open as 32 failed to break and RSI O/B. Long of 9980 and RSI O/S.Hold for the PD and take an exit, but not a short.... Maybe a short on the second PD? Then sit it out..... and the close/reverse clue came as the channel failed to make support and DB at 25.Maybe you got in at the res break just before at 40... Either way, the bull flag gave a target of 95.( from 25) and an out on the second peak at 97. But why? All three bull flag targets were saying 93, 93 and 96.How could it go higher?You should have tracked the las two on the way up, calculating the targets as you went.
So a short at the open as 32 failed to break and RSI O/B. Long of 9980 and RSI O/S.Hold for the PD and take an exit, but not a short.... Maybe a short on the second PD? Then sit it out..... and the close/reverse clue came as the channel failed to make support and DB at 25.Maybe you got in at the res break just before at 40... Either way, the bull flag gave a target of 95.( from 25) and an out on the second peak at 97. But why? All three bull flag targets were saying 93, 93 and 96.How could it go higher?You should have tracked the las two on the way up, calculating the targets as you went.
Attachments
tradesmart
Experienced member
- Messages
- 1,286
- Likes
- 22
All the very best with the electronic climbing wall CM, and I hope it’s a commercial success to the extent that you will be buying all of your many loyal fans on T2W a drink – bottles of champagne in the post would be very acceptable I’m sure…… :cheesy:
I was a bit concerned that the chap in the photo wasn’t wearing a parachute….I imagine it’s a bit like climbing the ‘wall of worry’ on Wall St…….I always wear a parachute when trading – you never know if you’re attached to something that’s going to fall off a cliff……… 😕
BTW – what does the ‘electronic’ bit in the climbing wall do……..?
Regards
TraderTony
Active member
- Messages
- 180
- Likes
- 1
Tuesday 28th September 2004
10:17 TLB back down with cross back over 100 ema but I did not take it as no clear direction in early action. Turned into what could have been an excellent entry running down to new lows and below yesterday's low before any TLB back to upside (over 20 points profit on first clear exit). Too cautious.
11:06 TRADE ENTRY 1) S 9900 on TLB down on resistance at 100 ema. Against a big PD on 10m chart at last bottom. Not looking great - potential bull flag.
11:11 EXIT: -4 on TLB back up. Could have reversed as the failure took it above the 100 ema (but I didn't).
11:43 TRADE ENTRY 2) L 10012 on TLB up (although after ND on last highs).
11:51 EXIT: +11 on potential triple ND over exactly 25 mins. Doh - too soon. How annoying is that.
12:21 TRADE ENTRY 3) L 10030 on TLB up after sideways action. Moved up nicely then reversed sharply at new HOD - fake out? Moved stop to b/e.
12:31 Exit: +4 on TLB down.
13:18 TRADE ENTRY 4) L 10026: TLB up after retracement to 100 ema.
13:22 EXIT: b/e - no follow through and TLB down.
14:29 TRADE ENTRY 5) L 10038. TLB to upside after sideways above 100 ema. Moved up nicely but stalled on taking out HOD.
14:41 EXIT: +11 on TLB back down.
14:42 TRADE ENTRY 6) L 10051. TLB back up after consolidation.
14:45 EXIT: TLB back down -1.
14:50 TRADE ENTRY 7) L 10052. Another go at it. Moves up nicely this time.
EXIT: 15:03 +12.
15:07 TRADE ENTRY 8) L 10064. Another break up. Too soon.
15:08 EXIT: -4.
15:14 TRADE ENTRY 9) L 10066. Another TLB up - earlier entry premature, although ND on CCI. Flying!
15:24 EXIT: +21. Nice!
Can it keep going? Triple ND on CCI now so warning.
15:31 TRADE ENTRY 10): L 10085. Moves up but stalls at high with potential quadruple ND. Stops to b/e.
15:36 EXIT: filled at -1.
I've done well so will avoid any more against the quadruple ND and go watch the football.
+49 from 10
+134 from September so far
Attachments
week so far
Hi
Been a quiet but sweaty week for me.
I finished last week with closed positions profit of +447
BUT
I had open positions (9 longs) which were well under water. At close of play on Friday they were -1109.
Yet again, I tried to be too clever and closed my shorts too early and got into repeat longs on the way down which were too close to each other and actually started too soon.
I didn't want to risk any more so although I saw the 9950 to 9980 reverse level yesterday, decided not to add-in more longs there🙁
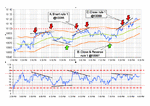
Nice ending diagonal finished at yesterday's low and you know the rest. The wavers saw the ed developing and I saw salvation!
Nice bounce up yesterday despite oil at new highs just shows that the relationship of oil to market is complex.
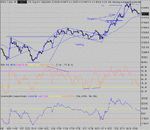
10100 was the upper line of the channel in blue. (3rd wave in red channel)
Realistically there are two likely outcomes from here I think. Either the touch at 10100 was the end of wave 4 of the channel OR the whole thing has finished and we're consolidating on the lows 🙁 or retracing up 🙂.
Technically I have some difficulty with the wave count. The blue channel is either a completed 3:3:3:3:3 pattern or we're finishing the 4th wave of a 5:3:5:3:5 pattern.
38% retrace of the blue channel targets 10120 or so
50% retrace 10165 or so
62% retrace 10209 or so.
On the basis that EDs imply good reversal AND the blue channel can best (I think!) be described as a larger degree ending diagonal (3:3:3:3:3) ... I'm staying long and looking for 10165 or 10209 initial targets.
Yes of course, my nails are bitten upto the elbows and yes my coronary arteries have taken another bashing, but I've recognised yet another lesson for me to learn. Have confidence in the wave predictions but be flexible with timing and therefore be patient collecting positions and after that let your profits run. IF I'd stayed with my initial heavy shorts from 10330 to 10250 range (remember last week?) I'd be a very happy bunny by now. Yes, I know, water under the bridge. Good to recognise lessons though ... perhaps next time I'll play better.
This week the underwater longs can manage with a snorkel now, at -419 from futures this AM.
FWIW, MarketVolume reckon another small drop coming (?5th wave) and EWI are looking for retracement as described above.
Good luck to everyone.
Regards,
Graham
ps, sorry about the watermark on the graph ... I haven't paid for the software yet🙂
Hi
Been a quiet but sweaty week for me.
I finished last week with closed positions profit of +447
BUT
I had open positions (9 longs) which were well under water. At close of play on Friday they were -1109.
Yet again, I tried to be too clever and closed my shorts too early and got into repeat longs on the way down which were too close to each other and actually started too soon.
I didn't want to risk any more so although I saw the 9950 to 9980 reverse level yesterday, decided not to add-in more longs there🙁
Nice ending diagonal finished at yesterday's low and you know the rest. The wavers saw the ed developing and I saw salvation!
Nice bounce up yesterday despite oil at new highs just shows that the relationship of oil to market is complex.
10100 was the upper line of the channel in blue. (3rd wave in red channel)
Realistically there are two likely outcomes from here I think. Either the touch at 10100 was the end of wave 4 of the channel OR the whole thing has finished and we're consolidating on the lows 🙁 or retracing up 🙂.
Technically I have some difficulty with the wave count. The blue channel is either a completed 3:3:3:3:3 pattern or we're finishing the 4th wave of a 5:3:5:3:5 pattern.
38% retrace of the blue channel targets 10120 or so
50% retrace 10165 or so
62% retrace 10209 or so.
On the basis that EDs imply good reversal AND the blue channel can best (I think!) be described as a larger degree ending diagonal (3:3:3:3:3) ... I'm staying long and looking for 10165 or 10209 initial targets.
Yes of course, my nails are bitten upto the elbows and yes my coronary arteries have taken another bashing, but I've recognised yet another lesson for me to learn. Have confidence in the wave predictions but be flexible with timing and therefore be patient collecting positions and after that let your profits run. IF I'd stayed with my initial heavy shorts from 10330 to 10250 range (remember last week?) I'd be a very happy bunny by now. Yes, I know, water under the bridge. Good to recognise lessons though ... perhaps next time I'll play better.
This week the underwater longs can manage with a snorkel now, at -419 from futures this AM.
FWIW, MarketVolume reckon another small drop coming (?5th wave) and EWI are looking for retracement as described above.
Good luck to everyone.
Regards,
Graham
ps, sorry about the watermark on the graph ... I haven't paid for the software yet🙂
Attachments
Last edited:
At close of play on Friday they were -1109
Graham, I hope the longs come good for you, personally I wouldn't be sleeping at night! 😱
The chatroom has been very quiet this week, drop in and say hello if you are around so I don't nod off during those quiet periods 😆
Justyn.
Did I mention something about a "W" bottom a few posts back?.....
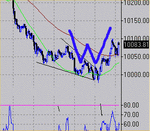
Chartman, I am struggling to see exactly where the W bottom is (if it is one yet). Are you refering to a double bottom at about 10000 with the middle of the W the pull back to around 10050 ...
... or maybe this bounce to 10100 will form the middle of the W and we will go back down to 10000 again before up and Northbound?
Cheers!
Justyn.
TS
The electronic bit of the wall allows you to pre define a route. Then you have to climb the route, not touching any other holds, in the shortst time you can. Each hold lights up in sequence to tell you the next move. Each move has a time slot against which you have to compete. So you can make each time slot 1 second- unbeatable, so you get a measure of comparitive performance and an overall time taken to do the climb.
The electronic bit of the wall allows you to pre define a route. Then you have to climb the route, not touching any other holds, in the shortst time you can. Each hold lights up in sequence to tell you the next move. Each move has a time slot against which you have to compete. So you can make each time slot 1 second- unbeatable, so you get a measure of comparitive performance and an overall time taken to do the climb.
tradesmart
Experienced member
- Messages
- 1,286
- Likes
- 22
CM - Sounds like a great and original idea and I’m not surprised that everyman and his dog wants one…..and we might see it at the Beijing Olympics……….Wow……!....... :-0
How high is the wall or is it variable/adaptable…..?
And when will CM Unlimited Ltd be going public….?
I wouldn't mind picking up a few shares……. 😉
How high is the wall or is it variable/adaptable…..?
And when will CM Unlimited Ltd be going public….?
I wouldn't mind picking up a few shares……. 😉
trendie
Legendary member
- Messages
- 6,875
- Likes
- 1,433
The range today has been 50points - quite narrow.
Will todays 7pm move be in the same direction as yesterday ?
I am seriously in danger of wiping out my account after only 7 days - is this a record ?
Please someone say they have a bearish view, and its going to drop to 9,980 !!
Will todays 7pm move be in the same direction as yesterday ?
I am seriously in danger of wiping out my account after only 7 days - is this a record ?
Please someone say they have a bearish view, and its going to drop to 9,980 !!
Trendie,
I am hoping for a push up from here but I could of course be wrong, I usually am.
No expert on EW but to me it looks like we just had an ABCDE move up with an ABC pullback in progress now.
Oil sliding down could be the catalyst for another ABCDE move up.
Justyn.
I am hoping for a push up from here but I could of course be wrong, I usually am.
No expert on EW but to me it looks like we just had an ABCDE move up with an ABC pullback in progress now.
Oil sliding down could be the catalyst for another ABCDE move up.
Justyn.
TheBramble
Legendary member
- Messages
- 8,394
- Likes
- 1,171
Dow has been awarded the 'Most Boring Index of the Day' title.
Anyone planning to trade a breakout 10070-10100? The volume looks so 'in tune' with the price. I.E. flat, flat, flat.
Does this mean it's likely to stay put for a while?
I don't normally look at indices, but feel I've been neglecting this part of my trading education.
Anyone planning to trade a breakout 10070-10100? The volume looks so 'in tune' with the price. I.E. flat, flat, flat.
Does this mean it's likely to stay put for a while?
I don't normally look at indices, but feel I've been neglecting this part of my trading education.
trendie
Legendary member
- Messages
- 6,875
- Likes
- 1,433
Took a large loss, cos I didnt take a small loss.
2 SELLS closed out at 10,025.
On the basis of First-In-First-Out thats;
10,009 = -116 points
10,021 = -104 points.
All my last weeks gains up in smoke.
I still have 3 SELLS running. ( 10,027, and 2 at 10,055 )
These still have stop-losses at 10,200.
I am still thinking too much, reading too much into miniscule movements, when I know I can trade EOD.
not a good day: MY FAULT, I should have cut much sooner.
tradesmart
Experienced member
- Messages
- 1,286
- Likes
- 22
Commiserations Trendie – imho a 20 point stop max is you’re best friend when trading this Mutha – it can get away from you very quickly if you hesitate – the first cut really is the cheapest…..
Bramble – it was bound to be a bit boring today after covering 120 points yesterday, so a bit of consolidation going on, but still moving up…..
No sign of a divergent top yet on 60min RSI, so maybe 38.2% fib of the recent down move at 10132 ish, or 50% at 10180 ish are beckoning…..?.....(132 now attacked....!)
The ‘bottom’ doesn’t look wide enough to support a big up move, so I suspect it might find a reason to backtrack again before another attack on the recent highs..........
Aside from big moves on a handful of stocks, the mood on Wall Street remained muted as the fiscal year end machinations of thousands of big mutual funds wound down.
More than one third of mutual funds end their fiscal year at the end of September, and managers tend to engage in a fair amount of "window dressing" - eleventh-hour buying and selling to make their portfolio look a bit better for their fundholder reports. Year-end window dressing tends to add downward pressure on underperforming stocks, and money managers aim to lighten up on the losers for their books. Conversely, the winners tend to get a boost as money managers want to show investors that they have been in on the year’s solid performers.
Now that that activity has largely passed, one of the rising factors on the market in recent days is the massive betting on a rally that often ensues after a presidential election, especially one in which the incumbent wins.
"This post-election rally is the most telegraphed move in market history," said James Altucher, hedge fund manager at Subway Capital. Mr Altucher says that Wall Street is positioning itself for a victory by President George W Bush and a removal of uncertainty surrounding the election.
However, the fact that every one is making this bet leads him to believe that "today is the time to buy and Election Day is the day to sell. I think all the mutual funds positioning themselves to get ahead of the predicted post-election news is what's going to drive the market from now until election."
Attachments
Last edited:
Bill
Active member
- Messages
- 160
- Likes
- 1
At last!.......
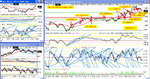
This was a near perfect day for the 15 emas rules. Nice bounces from the boundaries as per the attached chart.
I took two trades as shown but perhaps a rather risky reversal at B. The overall sentiment seemed positive since the price had barely touched 100ema -15 all day, hence this risk. To make 32 points in one trade using this method is unusual since the distance between the boundaries is only 30 points. I was looking for a break of 10100 at C so let the last trade ride.
I've included all the arrows even the ones I didn't trade and I reckon that if I didn't have to wait till after 5:00pm I could have come out with double the number of points.
+51 today.
Bill 😀
+-15 ema Rules are
1. Short if price crosses 100ema and touches/crosses 100ema+15
2. Long if price crosses 100ema and touches 100ema-15.
3. Short if nd and price is 100ema +15 [or v close]
4. Long if pd and price is 100ema -15 [or v close]
5. Don't trade in the 1st hour
6. Stop losses above/below obvious SR
7. Don't open a trade in the last hour
Attachments
Last edited:
TraderTony
Active member
- Messages
- 180
- Likes
- 1
Wednesday 29th September 2004
9:38 YM feed on mytrack gone down - no charts. Back up at 9.49 but no back fill so unhappy trusting signals for a while yet.
10:04 TRADE ENTRY 1) S 10061 on TLB after retrace to 100 ema. Moved well to +8 then stalled.
10:08 EXIT: +5 on stalling price/TLB (albeit not very clear one) - anxious to get a win on first trade so a bit hasty to close I think. Yep - exit definitely too quick and forced - soon down to new lows without violating the clearer TL. It actually bounced quite hard again though so probably would have exited around the same level of profit.
10:20 TRADE ENTRY 2) S 10058. Again, TLB after reaching 100 ema but slightly late entry. Moved quickly to +11 then reversed so quickly I was caught out.
10:31 EXIT: b/e on sharp reversal. Turns out it was oil inventory numbers.
10:48 TRADE ENTRY 3) L 10078 on TLB to upside after move above 100 ema.
10:55 EXIT: +2
11:03 TRADE ENTRY 4) L 10079 on another TLB to upside although last peak gave first ND.
11:10 EXIT: +2. Could be forming H/S with ND between left shoulder and head.
12:10 Possible short entry on TLB after peeking above the 100 ema but I didn't take it as it hadn't really moved convincingly below the 100 ema (not 20 points below). Turned out to be a decent entry with hindsight.
12:26 TRADE ENTRY 5) S 10062. Still hanging below 100 ema. No follow through at all.
12:30 EXIT: -2. TLB back up. Like yesterday, I didn't reverse when it would (again with hindsight) have been a good idea to do so as failure was so close to 100 ema.
12:40 Surges up on the failure of that last trade to new highs across all indices. Frustrated to have missed the move.
12:59 TRADE ENTRY 6) L 10081. Hoping for another push up. But nothing.
13:04 EXIT -2. Damn. Bottom tick before it moves up.
I am going to start looking closely at trades I take between 12 and 13:30 est to see if they are, on average, worth bothering about.
13:27 TRADE ENTRY 7) L 10077. TLB right at 100 ema. And again absolutely no follow through.
13:31 EXIT: -4. Argghhhh. Again, bottom tick before springing up. Not enjoying this at all.
13:47 TRADE ENTRY 8) L 10078. Try again. Went nicely to +6 and stalled. Sideways. Sideways. And sharply down.
13:56 EXIT: b/e. I cannot buy any follow through today. Very frustrating. Oil again apparently.
Looked like a break down on 10m flat topped triangle but it doesn't want to go down.
14:55 Yep - forced it's way up now to hit (but not yet take out) the highs.
15:02 TRADE ENTRY 9) L 10089. On retracement but late getting in. Moves up well then stalls around 103 level.
15:09 EXIT: +12. Probably too soon again but wanted to pocket some winnings today - it's been rough so far.
15:16 TRADE ENTRY 10) L 10103 for another move up. Moved a little, stalled and reversed sharply.
15:19 EXIT -2. First ND for this move on both RSI and CCI.
15:34 TRADE ENTRY 11) L 10100 - perhaps one last chance. Up a little and wobbles.
14:46 EXIT: +13.
+24 from 11 (excluding costs - really +13 taking 1 point per trade per contract for commission).
+158 for September so far (excl. commissions)
Although profitable I found today really frustrating and feel I should have done much much better. We actually had some range today and yet I seemed to miss most of the moves.
Attachments
Hmmm seemed to have trouble timing my entry/exit points today.
(I don't always have time to post my chart and analysis here every day but I'll try to when I can)
Point A - bull flag failure. Could have gone short before the price dropped below the flag support line but decided to wait and be sure - have been burnt before!
All was going well, price dropped 20 points to B then pulled back 10 points to "C" with high RSI - great, another 20 points down to come. I waited for my target, 64 to exit but never got there, at point D there was a tiny triangle which I expected to break down to the target but it broke up and started moving sharpish! So exit for +4. Rats, could have been 15 points there.
Missed the first pullback at E as I was still wondering what had just gone wrong. Saw the two 15 point moves up and the second pullback so went long here. Was expecting another 15 points up so should be able to snatch 15 points here right? Wrong, only 10 points up and the briefest of bounces off 10100 at F so exit for +2.
Noted the expanding triangle forming from F to G (sorry about the trendlines, I redrew them in Photoshop). The triangle broke upwards at G and started to form a bull flag.
Do I go long? The price is jammed between 095 triangle top and 100 where it had bounced down earlier today. Plus we had one flag failure today already. So I waited until 100 went to go long.
At H it looked like the move had run out of steam. Volume had dried up, this peak was lower than the last and it was getting late in the day so I exited for +4 again. Just before the price motored on skywards.
So to summarise, a lot of hard work for 10 points before commission. Never mind, there's always tomrrow.
Glad you did ok today Bill & Tony, bad luck to Trendie 😢
Justyn.
Attachments
Justyn.
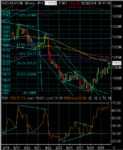
Point A in your chart is a Bear flag..... guaranteing the "W" bottom from the open would fail...
The 10 min "W" has done the biz, leaving us with a triangle break late into the session with an unmet ( as yet) target of 170. So a falter at 164 should signal a short tomorrow.... Did you get the triangle on CCI?