You are using an out of date browser. It may not display this or other websites correctly.
You should upgrade or use an alternative browser.
You should upgrade or use an alternative browser.
Trend Days
Hi folks, Back from hols so I've been able to look up some definitions of trend.
First, courtesy of China White if my understanding of his posts is correct: ( All times EST )
Trend day if high Beta indicies are leading the market, by looking at percentage change since market open ie 0930. The following should be leading by at least 2:1
SOX>COMP>DOW; NDX>SPX: XBD>SPX
Check for trend at 1030, 1300, 1415 ( I may have missed other times )
If it is a trend reversal day, this is often indicated first by MACD ( 5,35,10 ) histogram of the SPX after 1300 ( 5 min chart ). Look for ND/PD of price v MACD histogram
Second, courtesy of Skim from the No indicators thread:
Dow, Nasdaq and S+P 500 must all be in synch for a trend to occur.
I vaguely recall LInda B R had one using the ADX(14) indicator, which I can't find at the mo.
Maybe someone else can recall this?
I've no doubt others will have different def's of trend, but hopefully this will help refine the 100ema +/- 15 system for the moment
tradesmart
Experienced member
- Messages
- 1,286
- Likes
- 22
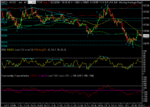
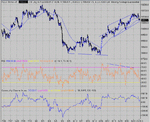
Just a reflection on 1-2-3 setups occurring at reversal points today…..sometimes more noticeable than others, but it obviously pays to count to ‘3’ before entering the fray….
Almost as easy as a-b-c………!.............?!
🙄
edit – 60min chart added with 3-peak (that number again........) ND-RSI showing the way down, and we’ve just about reached the 50% fib retracement point of the 10490-9790 downmove, so clearly a decision point…..
Almost as easy as a-b-c………!.............?!
🙄
edit – 60min chart added with 3-peak (that number again........) ND-RSI showing the way down, and we’ve just about reached the 50% fib retracement point of the 10490-9790 downmove, so clearly a decision point…..
Attachments
Last edited:
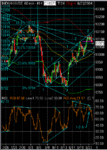
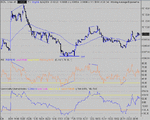
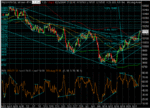
Not the continuation that I thought... but the open failed to break the HOD from Friday and that set the tone for the rest of the day. Some short time delivering divergences showed up today too,breaking the 25 minute rule.... Interesting volume peaks on ES worth a look at too, to give a second confirmation of those peaks and troughs, if you needed them.Seems the volume peaks go in three's too......
Attachments
TraderTony
Active member
- Messages
- 180
- Likes
- 1
No trading for me today and probably not much all week as I have promised a 'proper' week of holiday to the family. Just looking quickly at the charts suggests I may have done well to keep away today. Hope everyone found a way to come out on top.
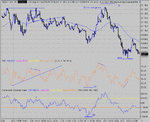
Hmmmm... my 10 min chart and comments seem to have vanished into the ether..... I'll try again.... broadly agreeing with TS, but I think today may have delivered the ND to take us to the channel support, so we go back up- there's room in RSI and CCI to do it.
Attachments
Bill
Active member
- Messages
- 160
- Likes
- 1
Hi
Here's my take on today, although other commitments [was 'maintaining domestic harmony'] meant I could only take the odd peek at the markets.
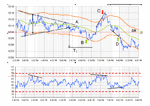
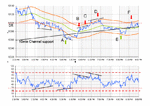
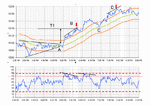
1st hour or so saw the price stay inside the 100ema channel and suggested a sideways ish day.
A; saw a triangle just after 5:00pm when I got home from work with target around 10075.
B: Conflict here. Looks like a bounce off the lower band but on the other hand that tri has not yet delivered.
C: I think was the best opportunity with nd, albeit short but close to the +15 band. Also near magic 32.
D: Snook out to have a quick look at the charts here and saw what I thought was pd and a touch on the lower band. This quickly morphed into a non pd pattern but I thought I'd show the mistake anyway.
T1 finally met? Don't think it's valid after that much time and price movement.
Still I think I could have made a shilling or two out of this today. Pah! visitors.... damn nuisance.
Regards
Bill
Attachments
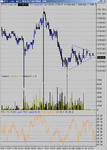
My take on today ...
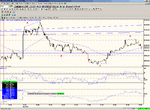
Playing the divergences. Good gamble on the divergence at point A, getting out at B.
Noticed the descending triangle form inbetween B and C and deliver its target.
Then playing the diveregence at C with an exit at D.
The second peak at point D had only about half the volume of the first peak (on ES) so I took it as a good clue that there wouldn't be a third peak to come.
Could have gone short again at D and it would have paid off with an exit at about 20:20 based on divergence again. And I suppose ... could then have gone long at 20:20 looking for an exit before 21:00 when Finspreads closes on the day.
Hope you all had a good day trading!
Justyn.
Attachments
Bill
Active member
- Messages
- 160
- Likes
- 1
Hi
My opinion on todays Dow.
Initial reaction to the attached chart is 'too many red arrows!'
Let me explain.
A Home form work at 5:0pm and I decided we were in a down-trend day. The +-15 ema channel would therefore be of little use. Long taken on the basis of RSI OS, short pd, at channel support and at magic 64. I was still nervous about this entry though given negative sentiment. I was just looking for a bounce from under the 100ema for a close and possible short.
B: 100ema breached so close the long. [+14] Look for a short opportunity....
C: ...here it is a bit of nd ! [Well no it's not actually.] I took a short anyway.
D: Oh dear it's not a down day after all. We're back above Res @ 10100. Open trade is now near the stop loss but I see nd. Decided to move the SL out instead of opening another trade. I felt by this time we were into the +-15 rules. So this would be short rule 3 but leaving the open trade running.
E: Closed around E but only got +2. Rule 2
F Took a short Rule 1 here and rolled the stop to BE. Stop was taken for 0 points
+16 on the day! That's OK!
Comment
I felt this was an example of a down day morphing into a sideways one. Whilst I was left with a bad trade I think that by recognising the change it was possible to at least prevent further losses and at best make a small profit.
Or did I just get lucky?
Regards
Bill 🙂
+-15 ema Rules are
1. Short if price crosses 100ema and touches/crosses 100ema+15
2. Long if price crosses 100ema and touches ema-15.
3. Short if nd and/or price is 100ema +15 [or v close]
4. Long if pd and/or price is 100ema -15 [or v close]
5. Don't trade in the 1st hour
6. Stop losses above/below obvious SR
Attachments
Nice of the indicies to illustrate yesterday's post on trend days ( well almost ) :cheesy:
Took a while to show itself as trend down because of the opening gap up.
However at the 1st PD, Justyn's exit, it was def trend down, confirmed by the triangle which I didn't spot. The 2nd PD at 64 looked more like the real bottom and a quick look at both INDU+
SPX MACD on 5 min confirmed PD as well. Rule broken though as it occured at 1245, should be 1300 or later. Maybe I'll change that to 1230 in future.
One note is that this MACD div is fairly unusual but can be brill in sorting out trend reversal days for +100, - 100.
Also, if anyone remembers China's Tick divs, Justyn's 2 pk exit at D on lower vol was confirmed by a cracking ND of Tick ( 5 min) v ES.
Interesting day, hope you had a good one 😀
hampy
Someone said last week (I think) that Wednesday is historically the most likely day to be a trending day.
I had a rainy day out in Wales today with "her indoors" but got home this evening to see the upward trend and once 64 was convincingly broken I went long for a nice easy 20 points. After all, they say the trend is your friend ;-)
HOD looked like it was very near to the top of the top channel on the 10 min chart roughly 200/210 so a good spot to get out.
Hope some of you guys here managed to catch a few more than 20 points!
Justyn.
Last edited:
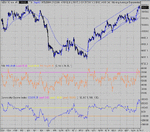
Didn't quite make 064 for a nice long,but close enough and well into OS to take the risk.... The rest of the day was easy for sitting on the 100MA, but very short on targets, save for T1, which made it really hard to make decisions. Easy re- entry at 144 off OS. One of those days where it's better not to look for shorts....
Attachments
Bill
Active member
- Messages
- 160
- Likes
- 1
Oh dear not so good today....
Pity we can't do it all again I'm sure I'd get it right next time!
A Home from work just after 5pm and noticed the strong up move. The pattern to there seemed like a sideways even negative pattern so I wasn't expecting much from the move and I also thought that it might be a news spike. Wrong! I reckoned on a target of about 10135. [Sorry not very well drawn on the chart]
B Some nd and target met plus magic 32 so, as I'm still thinking sideways, I went short @10130. Stopped out at 10150. -20. Bad start.
I wasn't unduly bothered by that but where I am kicking myself is in not recognising that sentiment had moved firmly positive. I should now have been looking for buying opportunities.
C A suitable one appeared here with the touch onto the 100ema yet I was still looking for a break downward and then a possible long from ema -15.
D Saw some nd here and took a short at 10192 which I immediately regretted. It did move into profit but always seemed to be threatening the 10200 break. I finally closed it with a sigh of relief ar 10183 just before 9:00pm for +9
-11 for the day and should have gone long at C
Look at the chart and notice how the ema +15 line provides support and when that fails the 100ema shoves it back up there.
Plenty of points to be had today I hope you all did better than me. 😱
Regards
Bill 🙂
Attachments
Bill/ChartMan,
there were a few examples of ND during the day as shown on CM's chart. Having joined the action late in the day I decided that it looked like one of those "the only way is up" days.
I did miss the OS signal at 144, waiting instead to see 64 break.
If I had been trading from the open I may have seen things in a different light. No two days are the same, yesterday just seemed to be a day for trading divergences, today was a day to go with the trend.
Always easier with hindsight of course!
Justyn.
tradesmart
Experienced member
- Messages
- 1,286
- Likes
- 22
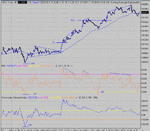
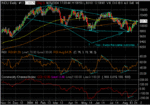
No trouble blasting through the 50% fib level at 10140 yesterday, so very likely 61.8% at 10220 ish is in the sights……RSI high on the 60min chart, but maybe the price can run a bit higher to create a ND top before we retrace, however 10200 has been serious resistance before and we’re touching the top channel line for the third time….all this on the seasonal effect known to some as “low-volume levitation”….!
It was rallying when oil was nearly $50/b and now oil is below $45 it's on turbo…..!?
When the Dow is on the way up bad news apparently doesn’t matter and good news fans the rally flames….
Just like when it’s on the way down good news doesn’t matter and bad news feeds the bears…..
Funny old market…….. 😆
Even funnier:- By the close, the Dow Jones Industrial Average was up 0.8 per cent to 10,181.81, while the S&P 500 index added 0.8 per cent to 1,104.97. The lockstep movement of the two indices suggests algorhythmic or programme trading. While some traders dismiss it because of the small change in prices, others deride the increased presence of such trading strategies................
Attachments
Last edited:
tradesmart
Experienced member
- Messages
- 1,286
- Likes
- 22
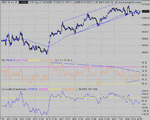
Testing the top channel line on the daily chart, so we’re clearly at a critical juncture, but RSI and CCI are looking upwards – no sign of ND topping, so very likely some upside to come.
If we get a clean break of the ema’s (100 & 200 shown in this view) it could be the start of a new bull phase that could take the index into the 11000’s – but only speculation for now, as Wall Street still has to climb the inevitable ‘Wall of Worry’ to get anywhere (and is oil on the way down, or halfway up.......?!)
After the 7 month meandering consolidation this year following the big run up to 10750 from the 7400’s in March 03, the index looks like it’s winding up for a big break…..
(I left the ‘speculation’ arrow on the chart from a couple of weeks ago, when I was questioning whether the bottoming formation at 9790 was similar to the bottom that occurred in March – nice to know that ‘pattern recognition’ works…… 😉 )
Attachments
Similar threads
- Replies
- 135
- Views
- 19K

