You are using an out of date browser. It may not display this or other websites correctly.
You should upgrade or use an alternative browser.
You should upgrade or use an alternative browser.
FetteredChinos
Veteren member
- Messages
- 3,897
- Likes
- 40
lets hope you're right trendie 🙂
FetteredChinos
Veteren member
- Messages
- 3,897
- Likes
- 40
Pars Pro Toto?
didnt know you were a classics student CJ 😉
didnt know you were a classics student CJ 😉
FetteredChinos
Veteren member
- Messages
- 3,897
- Likes
- 40
3 pk positive divergance on slow stochs and RSI.
shouldnt, stress, shouldnt, fall too much further.
shouldnt, stress, shouldnt, fall too much further.
FetteredChinos
Veteren member
- Messages
- 3,897
- Likes
- 40
dont ask me, im crap at forecasting....
looking for 10,200 by the close / a close above the day's midpoint..
hmmm..
looking for 10,200 by the close / a close above the day's midpoint..
hmmm..
FetteredChinos
Veteren member
- Messages
- 3,897
- Likes
- 40
hanging on for dear life..
added at 10,105
this pattern better "chuffin"hold..lol 🙂
added at 10,105
this pattern better "chuffin"hold..lol 🙂
FetteredChinos
Veteren member
- Messages
- 3,897
- Likes
- 40
10,131 is break-even...
looks like the 7pm reversal is kicking in......
not confident until i see what happens when the bond markets shut at 8pm.....
hmmm..
looks like the 7pm reversal is kicking in......
not confident until i see what happens when the bond markets shut at 8pm.....
hmmm..
Missed all the euphoria at start of the session therefore waited for patterns to emerge.
2:42 Gravestone Doji ,bearish pattern, put in Sell @ 10120
3:09 Falling three methods confirming bearish trend ahead
3:54 Exit @ 10100 , 20 points..
2:42 Gravestone Doji ,bearish pattern, put in Sell @ 10120
3:09 Falling three methods confirming bearish trend ahead
3:54 Exit @ 10100 , 20 points..
Attachments
Bill
Active member
- Messages
- 160
- Likes
- 1
Hi
Been out of action for 2 days with dead hard drive and other PC problems 🙁
Back now though 🙂.... don't get rid of me that easy. he he!
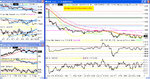
Home after 5:0pm to see very negative sentiment. +-15 rules were abandonded more or less. Having missed the big move in the 1st few hours I was looking for shorting opportunities and decided that the ema touch at A would do. The move up never really bothered me and if it had gone any higher, to 100ema +15, I had left in an order to add to the short. Never happened though. Closed a bit early at B for +19. I was looking for another entry and decided the market had now turned sideways at C and decided a long would be a safe bet but it was a bit late in the day so I took the December price. Not looking too good at the moment with 10100 looking in danger of breaking. Stop is below 10080.
+19 today.
Regards
Bill 🙂
Note: Capital Spreads simulator prices traded were below the Dow cash price today in case you think they look a little odd.
+-15 ema Rules are
1. Short if price crosses 100ema and touches/crosses 100ema+15
2. Long if price crosses 100ema and touches 100ema-15.
3. Short if nd and/or price is 100ema +15 [or v close]
4. Long if pd and/or price is 100ema -15 [or v close]
5. Don't trade in the 1st hour
6. Stop losses above/below obvious SR
Been out of action for 2 days with dead hard drive and other PC problems 🙁
Back now though 🙂.... don't get rid of me that easy. he he!
Home after 5:0pm to see very negative sentiment. +-15 rules were abandonded more or less. Having missed the big move in the 1st few hours I was looking for shorting opportunities and decided that the ema touch at A would do. The move up never really bothered me and if it had gone any higher, to 100ema +15, I had left in an order to add to the short. Never happened though. Closed a bit early at B for +19. I was looking for another entry and decided the market had now turned sideways at C and decided a long would be a safe bet but it was a bit late in the day so I took the December price. Not looking too good at the moment with 10100 looking in danger of breaking. Stop is below 10080.
+19 today.
Regards
Bill 🙂
Note: Capital Spreads simulator prices traded were below the Dow cash price today in case you think they look a little odd.
+-15 ema Rules are
1. Short if price crosses 100ema and touches/crosses 100ema+15
2. Long if price crosses 100ema and touches 100ema-15.
3. Short if nd and/or price is 100ema +15 [or v close]
4. Long if pd and/or price is 100ema -15 [or v close]
5. Don't trade in the 1st hour
6. Stop losses above/below obvious SR
Attachments
Note the calculation of T1 ignores the gap at the open..... Note also the sucessive failures of the PD's- the market only wants down...... The OS CCI signalled the bottom for sure, and 10 below T1. Not a signal to go long. 132 did us no favours today either....
Attachments
tradesmart
Experienced member
- Messages
- 1,286
- Likes
- 22
How on earth did that come about?
A delayed reaction to Big Al’s efforts yesterday CM, I suspect – he likes to test his tanking abilities on a regular basis……. 🙁
(profit warnings and oil $ don’t help either imho)
Strange widths on the day breaks.Is that a glitch with Sierra or does someone know a fix?....
Version 52 SierraCharts recently released and ready for download – my chart for the same period is ok
Regards..
ps - there's a list of the upgrades functions/glitches on http://sierrachart.com/new.html
Last edited:
tradesmart
Experienced member
- Messages
- 1,286
- Likes
- 22
Correction - my 15min chart has the same problem on max view - but the problem disappears when you zoom in a bit.........
pass...... 😕
pass...... 😕
TraderTony
Active member
- Messages
- 180
- Likes
- 1
Jeez - at last we get a big trending day but a minor family accident (nothing serious thankfully) left me literally holding the baby and unable to trade. I hope I would have found a decent place to go short but the repeated PDs would probably have played havoc with my emotions!
Let's hope we are going to start getting some action now.
Let's hope we are going to start getting some action now.
Attachments
Wednesday
Hi,
Just a quick note to admit my failings!
Wednesday was NOT a good day for me.
I know not to but still tried to catch that falling knife. Must remember, the trend has stopped (but for how long?) when the 30 ema crosses the 100 ema on 5 / 10 minute charts for my purposes.
Reminds me of the adage ... keep it simple, stupid.
Anyway, after being up +214 from Monday and Tuesday, I'm now underwater -168 for 7 positions.
You don't make a loss until you close and it's not over till the fat lady sings ... but I'm not a happy chappy.
MA volume analysis says up, today / tomorrow / early next week (thanks for the timing guys!); EW says wave count finished so up. My gut say up today / tomorrow. I think TA says up but you'll know TA better than I.
So, I'm staying in; I see a low potential at 10070, with target upside around 240, 260, 280.
Good luck to everyone today.
Regards,
Graham.
Last edited:
Similar threads
- Replies
- 135
- Views
- 20K