You are using an out of date browser. It may not display this or other websites correctly.
You should upgrade or use an alternative browser.
You should upgrade or use an alternative browser.
TraderTony
Active member
- Messages
- 180
- Likes
- 1
Monday September 20th 2004
Decided to allow a little more discretion with trading today, especially when holding winning positions that reverse on me in these flat conditions. The intention was to use CM's approach but be prepared to scal in and out more frequently if required. It was not exactly a blinding success but that's largely because my execution was poor. If I'm going to get out sooner, I think I need to be prepared to cash in profits quicker too (I could have easily taken +10 on all four trades for example). Today I was caught between two stools - trying to hold the winners in CM style but then closing as soon as a winning position reversed to entry. I also kept taking longs and not reversing for TLBs short below the 100 ema, when short was clearly the place to be according to the CM approach, with the 100 ema consistently knocking it down again. My first entry short was very good but I exited stupidly and then took longs (which did go into profit) but didn't reverse the shorts - which were the better trades every time.
Had I stuck with the purer interpretation of CM I've been using before today I would have made a much bigger profit with less effort. But there you go. Too early to draw definitive conclusions as taking the trades in the direction CM's approach dictates could have worked nicely here
Stood aside of the triple peak PD but it worked out very well.
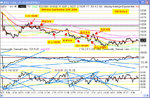
10:25 Returns to 100 ema but after triple peak PD from the opening gap so not wanting to trade short against that. NQ now positive for day (having closed its gap) but ES and YM still negative.
10:48 TRADE ENTRY 1): Short at 10248 after triple ND and break of CCI TL to downside. Risky against the earlier PD though. Jumped into profit and back below the 100 ema then stops dead. Unable to break RSI TL. Looks like that's held it and it's coming back up. From +12 all the way back to b/e. Strength in NQ causing the problems. Then into loss as it oscillates around the 100 ema and starts to form a possible triangle. Moved stop to b/e as it just won't follow through.
11:15 TRADE EXIT: Stopped out b/e (right on the top tick of the move and I didn't even wait for it to take out the swing high). And then it comes straight down. Damned if you do, damned if you don't. That is a real kicker - decided to use a bit more discretion and it has back fired straight away.
11:53 TRADE ENTRY 2): Long at 10231 on TLB on RSI/CCI just below 100 ema. Too early - it didn't take out 32. This is great - I should still be short with over 20 points in profit on the original and instead I'm long with a loser. How stupid do I feel. Eventually broke up a bit but no follow through despite using lots of RSI.
12:39 TRADE EXIT: b/e again as it crashes back down to reiterate the superiority of the original short!! Which would now be over 30 in profit. Make that over 40. Of course, I should have reversed rather than just exiting the long as it was crossing down below the 100 ema.
13:04 TRADE ENTRY 3): Long at 10209 (10204 YM) on three peak PD (albeit not quite 25 minutes). Would have been a decent entry if still short for about +38. Last attempt using this approach today as it has a right royal disaster so far. Pulled up nicely for +6 then +11 or so then back towards entry. Do I or don't I?
13:20 TRADE EXIT: b/e. What a surprise. I never cashed in the profit or let it run - between a rock and a hard place. And again, I should have reversed for the short on the TLB below the 100 ema which would have been a good trade.
13:41 TRADE ENTRY 4): Long at 10204 (10199 YM). OK - one more for the road on the bounce off 200, which is the bottom of the channel on the 10m, with a big PD. Bounces up sharply to 100 ema (+13).
13:52 TRADE EXIT: +20. Don't want to give it all back again on a nasty reversal bar just above the 100 ema and I have to finish soon anyway.
OK - I need to finish now and regardless I think I need to step aside and review what I'm doing here.
+20 from 4
+37 for September so far
Decided to allow a little more discretion with trading today, especially when holding winning positions that reverse on me in these flat conditions. The intention was to use CM's approach but be prepared to scal in and out more frequently if required. It was not exactly a blinding success but that's largely because my execution was poor. If I'm going to get out sooner, I think I need to be prepared to cash in profits quicker too (I could have easily taken +10 on all four trades for example). Today I was caught between two stools - trying to hold the winners in CM style but then closing as soon as a winning position reversed to entry. I also kept taking longs and not reversing for TLBs short below the 100 ema, when short was clearly the place to be according to the CM approach, with the 100 ema consistently knocking it down again. My first entry short was very good but I exited stupidly and then took longs (which did go into profit) but didn't reverse the shorts - which were the better trades every time.
Had I stuck with the purer interpretation of CM I've been using before today I would have made a much bigger profit with less effort. But there you go. Too early to draw definitive conclusions as taking the trades in the direction CM's approach dictates could have worked nicely here
Stood aside of the triple peak PD but it worked out very well.
10:25 Returns to 100 ema but after triple peak PD from the opening gap so not wanting to trade short against that. NQ now positive for day (having closed its gap) but ES and YM still negative.
10:48 TRADE ENTRY 1): Short at 10248 after triple ND and break of CCI TL to downside. Risky against the earlier PD though. Jumped into profit and back below the 100 ema then stops dead. Unable to break RSI TL. Looks like that's held it and it's coming back up. From +12 all the way back to b/e. Strength in NQ causing the problems. Then into loss as it oscillates around the 100 ema and starts to form a possible triangle. Moved stop to b/e as it just won't follow through.
11:15 TRADE EXIT: Stopped out b/e (right on the top tick of the move and I didn't even wait for it to take out the swing high). And then it comes straight down. Damned if you do, damned if you don't. That is a real kicker - decided to use a bit more discretion and it has back fired straight away.
11:53 TRADE ENTRY 2): Long at 10231 on TLB on RSI/CCI just below 100 ema. Too early - it didn't take out 32. This is great - I should still be short with over 20 points in profit on the original and instead I'm long with a loser. How stupid do I feel. Eventually broke up a bit but no follow through despite using lots of RSI.
12:39 TRADE EXIT: b/e again as it crashes back down to reiterate the superiority of the original short!! Which would now be over 30 in profit. Make that over 40. Of course, I should have reversed rather than just exiting the long as it was crossing down below the 100 ema.
13:04 TRADE ENTRY 3): Long at 10209 (10204 YM) on three peak PD (albeit not quite 25 minutes). Would have been a decent entry if still short for about +38. Last attempt using this approach today as it has a right royal disaster so far. Pulled up nicely for +6 then +11 or so then back towards entry. Do I or don't I?
13:20 TRADE EXIT: b/e. What a surprise. I never cashed in the profit or let it run - between a rock and a hard place. And again, I should have reversed for the short on the TLB below the 100 ema which would have been a good trade.
13:41 TRADE ENTRY 4): Long at 10204 (10199 YM). OK - one more for the road on the bounce off 200, which is the bottom of the channel on the 10m, with a big PD. Bounces up sharply to 100 ema (+13).
13:52 TRADE EXIT: +20. Don't want to give it all back again on a nasty reversal bar just above the 100 ema and I have to finish soon anyway.
OK - I need to finish now and regardless I think I need to step aside and review what I'm doing here.
+20 from 4
+37 for September so far
Attachments
TraderTony
Active member
- Messages
- 180
- Likes
- 1
Yes - well said Carlos. What I should have been doing was entering the TLBs short off the 100 ema and exiting when the TLs broke back up. By contrast, I was doing the opposite of this - entering the TLBs long and exiting on the breaks back down. That's why I was angry at not reversing as I was consistently out of synch with the trend. Ah well, another day, another lesson.
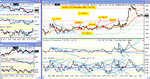
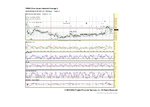
I'm no EW expert but was interested to note the three waves down yesterday. Thought I would post this chart to point it out for anyone interested.
A, B & C were three pushes down, each about 30 points. 1 & 2 were 15 point pullbacks with high corresponding RSI at Y & Z.
With hindsight (yes I know that makes it easy) if you spotted the first 30 point drop at "A" and the 15 point pullback at "1" with RSI at almost 75 it would have been a good entry point for a short guessing there were 2 more pushes down to come. Would have been good for 40 or 50 points profit.
Justyn.
Attachments
FetteredChinos
Veteren member
- Messages
- 3,897
- Likes
- 40
gonna be a narrow range today. possible bullish bias though. unlikely to break yesterday's low if the pattern holds..
just my thoughts.
FOMC could jazz things up though at 7.15pm
just my thoughts.
FOMC could jazz things up though at 7.15pm
FetteredChinos
Veteren member
- Messages
- 3,897
- Likes
- 40
FetteredChinos said:could be a good call that one TS 🙂
im still not sure which we we are going this week. but..at this early stage im expecting a bit more of a drop to circa 10,200 today, followed by a mini bounce back up to friday's close later today/tmr, before down again 'til wednesday to below 10,170.
of course, we could always get a narrow range day today to put a spanner in the works.
as always, trade what you see, not what you think.
FC
who's the daddy?? lol :cheesy:
that's part 2 accomplished
FC
FetteredChinos
Veteren member
- Messages
- 3,897
- Likes
- 40
i bought at 10,213 and sold at 10,263 so +50 apres spreads.
now we are at a crossroads. and could have a big move either north or south.
south is the favoured direction, as we have already started on that, and the target is closer lol 🙂
good trading, all.
FC
now we are at a crossroads. and could have a big move either north or south.
south is the favoured direction, as we have already started on that, and the target is closer lol 🙂
good trading, all.
FC
TraderTony
Active member
- Messages
- 180
- Likes
- 1
Excellent FC - I bottled the announcement (he who dares...)
Tuesday 21st September 2004
Fed announcement day. Could be tough before 14:15 est.
10:07 TRADE ENTRY 1): Long 10210 (207 YM) on RSI TLB to upside crossing back above 100 ema after gap closing on all futures. Quickly turns back around against me. Pops up again without breaking a TL to downside. But no follow through and quickly down again. Chop city. Turns into possible triangle which fails to break to upside on third touch. RSI eventually breaks up but no follow through on price or volume. This is dire. ES more bullish but YM wants none of it. New highs on ES and NQ but barely any YM follow through. T1 off triangle should be around 10235 or more.
11:29 TRADE EXIT: Stopped out at b/e after no follow through on the triangle break. Corresponding TLB on RSI but no price drop so could have exited on bottom tick of move again.
11:40 TRADE ENTRY 2): Long 10215 (209 YM). Re-enter previous trade after bouncing off 100 ema and TLB. Still absolutely no follow through though.
11:56 TRADE EXIT: Yet again, b/e after no follow through and TLB back to downside. And out on the bottom tick again before another move up. Well, something's not right here. This time it did go down a bit more after a brief bounce.
25 point range in 2.5 hours with Fed coming up - sensible thing might be to sit it out. Tough to walk away though.
12:41 TRADE ENTRY 3): Long 10215 (210 YM) on TLB (RSI and CCI) to upside off 100 ema. Just couldn't leave it alone! Failure on ES to take out highs quickly killed it.
13:01 TRADE EXIT: B/e. Gave up after repeated failures of ES to break earlier high. Probably too early this time as no TLB to downside but there is absolutely no movement anywhere here. It was too early but it would only have gone +5 before a TLB to exit still around b/e.
14:17 Shoots up on Fed announcement but it could have gone either way. Just as quickly down again. I'm going to keep out of this so watch it surge now.
14:56 Well it has moved strongly higher and it never would have taken out 100 ema -20 to downside though so I could still be long from my first trade and would be well in profit. So it looks like the modifications I've made have worked against me for the second day on the trot. Currently 50+ points profit I've missed out on, but my feelings are mixed - I chose to sit out of the Fed action and staying in would have been a gamble for me. At least I stayed on the right side this morning and am not displeased by the results there - breaking even in tight chop is a decent result for me. Obviously I should have re-entered at some stage for the up move but I just wasn't confident the wild swings were over.
Frustrating, but not a disaster.
B/e from 3
+37 from September so far.
Attachments
Guys,
Hi, I ‘ve been browsing the board for a while and will be commenting when I can on the candlestick formation for profit in the Dow Intra day trading. This is after doing a lot of homework on basic formations and so forth. For about a year I have been experimenting and have found out that for intra trading the dow the 3 min chart provides excellent patterns, all my comments will be in relation to the 3 min candlestick chart and the 100 MA. My first posting with the attached chart, apologies if it’s not clear.OK for today we had
09:45 bearish engulfing pattern and 5mins Dark cloud cover, therefore Sold @ 10218. Closed trade @ crossover of 100MA 10202.. 16 points.
Price back over 100 ma will wait for some more major candle patterns to appear.
12:15 Morning star pattern ,still above 100 MA bought @ 10211.
12:45 Hanging man appeared next session didn’t close under the wick which would ‘ve confirmed it bearish therefore will take this as a bullish pattern staying in trade.
14:15Trade exit @ 10235 , bagged 24 point plus 16 earlier total..40.
That’s it for me tomorrow’s another day.
Attachments
tradesmart
Experienced member
- Messages
- 1,286
- Likes
- 22
Happy now, TS with 220 in the bag?
I knew if we all shouted loud enough it would get there.........!.......... :-0 :cheesy:
and a few points more after Big Al had his 'shout' as well.........!?
(now mostly given back with tanking futs.. 😕 ..)
Well what comes next....?
Just a guess, but that lower rounded formation has got to be significant.....a head....?
or will it go for a triangle to work out a 'reaction' to the FED and the price of oil....?
Well, you have to speculate to accumulate..........allegedly........ 😉
Attachments
FetteredChinos
Veteren member
- Messages
- 3,897
- Likes
- 40
CM et al,
are you guys aware of Tom Hougaard's 3 spike rule for FOMC announcements. im sure he has mentioned it on here a few times, and certainly over on tactical trader.
essentially, using yesterday's as an example, there is a spike north as it is released, then the fake spike back down, and then the 3rd spike is the "true" one, which generally indicates the direction for the rest of the day.
so in theory, i guess the way to play it is to wait for the first spike, then put in an order slightly above/below where the price took off from, aiming for a continuation of the original direction.
doesnt always work, but when it does... 🙂
overnight i see the futures came storming down. 🙂 IG index quoted 10,180 as a low i think. i hope that isnt it, as i was quite hoping for a long from 10,170 today...
good trading all
FC
Monday, Tuesday
Hi,
Good week so far.
Carry over the weekend +30
Monday +12,+27,
Tuesday +25,+16,+24,+32,+15,+48
Week so far +229
Monday, held one small short over the weekend. Felt that the C wave down still needed a 5th wave and there was plenty of resistive volume with no compensatory supportive spike. Down it came, but as always got out too early. I read a very small 5 wave as being the necessary 5th wave but it wasn't ... it was only the first of the five needed for the fifth wave. Aaaaaargh.
Started collecting longs when the supportive volume picked up, we had nice pd's on rsi and cci. By Tuesday morning the market was looking decidedly overbought, additional resistive volume and a 3 wave retracement to the territory of the previous 4th wave, all said close the longs. I stll felt the retracement hadn't finished with the upside (didn't last long enough) so I kept one small long open and then watched as that triangle developed. Took another long at the bottom of the first drop within the triangle. Classic B wave (abcde) pattern and once the FOMC swing was over (which was pretty mild I thought), the C wave came up. I'm pleased I didn't overexpose going into the FOMC announcement but part of me wishes I had. That's the catch isn't it? Identify your impulses and control them. I don't find it easy. Anyway, the C wave described 5 waves and was 1.62 x "A" so it was time to get out. The very large resistive volume spke helped as well! Reversed to short and was happy to close for a small profit.
Although I don't report my spread betting figures here I had an equivalent small SB short open at the end of the day. I closed the IB short thinking "not much spread, let's get in and out" but kept the SB short open, thinking "I'm not paying 10 point spread for a measly +3 or so". So what happened? Futures tanking down this AM and I've closed that SB short for much more profit. Just a thought ... it's not always about transaction costs. I actually make more money with SB than IB, for identical setups. Must be something to do with closing too soon. Has anyone else noticed the same?
Seeing lots of ABC patterns, so difficult to project out much. Still believe we'll tank down to 9000/9500 soon.
Yesterday saw the finish of a large-ish ABC (3:3:5). By last night we'd retraced 50%.
EWI says much more down to come but they've been saying that for months. They do suggest that we'll need to see proper impulsive waves to the downside but so far we haven't.
Completely out of the market now, so I'll stand back and watch the reaction to the economic news out later.
Good luck all.
Graham
Attachments
tradesmart
Experienced member
- Messages
- 1,286
- Likes
- 22
Interesting technical posts Graham, and well done with the large points bag…….
I’m interested in the volume analysis that you are using – can you post a volume chart please……?
Regards
I’m interested in the volume analysis that you are using – can you post a volume chart please……?
Regards
Similar threads
- Replies
- 135
- Views
- 20K