You are using an out of date browser. It may not display this or other websites correctly.
You should upgrade or use an alternative browser.
You should upgrade or use an alternative browser.
FetteredChinos
Veteren member
- Messages
- 3,897
- Likes
- 40
will we see 9940 today??
hope so.
pattern this week could be eerily similar to last week.
9940 today. bounce to circa 10,000 late today/tmr. then down into wednesday for another stab at 9930, possibly lower to test 9,900 before a weak bounce on thursday/friday.
thats the initial plan. could go wrong though...
FC
hope so.
pattern this week could be eerily similar to last week.
9940 today. bounce to circa 10,000 late today/tmr. then down into wednesday for another stab at 9930, possibly lower to test 9,900 before a weak bounce on thursday/friday.
thats the initial plan. could go wrong though...
FC
trendie
Legendary member
- Messages
- 6,875
- Likes
- 1,433
Friday was Gravestone Doji, which is BEARISH.
However, Thursday/Friday is a BULLISH HARAMI !!
If you believe the next 2 days is a "breather", then the fall from 10,050 will be the same magnitude as from 10,270.
That is, a further 220 points fall from 10,050.
End-game of this trend around 9830.
This is consistent with the step-down, step-up fluctuations over the past few months.
This is over the next 1-2 weeks or so.
Short-term ( daily )
My money is on a potential retracement to around 10,100, and continued drop.
I have a LIMIT SELL at 10,100.
( still open SELL at 10,050, carried from last week stop-loss = 10,200 ).
Scale is difficult to tell.
The above analysis is abnormally detailed for me: ( I am trying out my new improved cats-entrails for prediction. )
trendie said:As the dates approach the spooky Oct 18th, plus or minus 2 days, the 9830 will give way to a bigger drop.
I won't get my hopes up but 9830 would be great seeing as though I am short from 10212.
😆
spooky Oct 18th
I've not heard of this before, could someone explain in more detail please? Does the Dow drop big style around this date every year?
Cheers!
Justyn.
FetteredChinos
Veteren member
- Messages
- 3,897
- Likes
- 40
nice one trendie, a bird in the hand and all that...(have a feeling it might be premature though)
anyone got thoughts on Oil at the mo? looks like it is going to try for $50 again.
that should fuel the bears (pun intended)
anyone got thoughts on Oil at the mo? looks like it is going to try for $50 again.
that should fuel the bears (pun intended)
trendie
Legendary member
- Messages
- 6,875
- Likes
- 1,433
justyn said:I've not heard of this before, could someone explain in more detail please? Does the Dow drop big style around this date every year?
Cheers!
Justyn.
Justyn,
this is just a general observation !!
Note:
1998 - Oct 01
1999 - Oct 15
2000 - Oct 20
2001 - ( Sep 11- distortion due to catastrophic event )
2002 - Oct 10
2003 - no discernable drop
If you view a Dow chart, you will notice that the latter part of the year has these severe dips.
The dates are spooky !!
I would personally be wary of being LONG for the next 3 weeks !!
Please note: although I am being flippnat with "Oct 18th", there is a general pattern.
Get a Dow chart - See for yourself !!
FetteredChinos
Veteren member
- Messages
- 3,897
- Likes
- 40
are we gonna break 10,000 today??
looking for a small long should we hit 9970, then adding to long to reach full size at 9940.
still some way off hitting both, but we shall see..
🙂
looking for a small long should we hit 9970, then adding to long to reach full size at 9940.
still some way off hitting both, but we shall see..
🙂
trendie
Legendary member
- Messages
- 6,875
- Likes
- 1,433
trendie said:Have just closed my 10,050 sell for 10,027. ( D4F )
I am really going to kick myself if it drops today without a retracement !!
I will re-initiate a SELL at 10,050 if it gets there.
+23 so far !!
Cant believe this!!
I did this last week - when I closed out a position for NO APPARENT TA reason.
However, it has "drifted" down rather than fallen.
But the 10,000 psychological barrier, if broken, may lead to accelerated sell-off ??
FC - you were right !!
FetteredChinos
Veteren member
- Messages
- 3,897
- Likes
- 40
trendie, dont beat yourself up after bagging a profit. who knows, it could have spiked up 100 points after the open.
+23 is a good start to the week.
🙂
oil has eased off slightly, and coupled with the 10,000 level, may explain the current stalling.
decision time, which way now?
😱
+23 is a good start to the week.
🙂
oil has eased off slightly, and coupled with the 10,000 level, may explain the current stalling.
decision time, which way now?
😱
FetteredChinos
Veteren member
- Messages
- 3,897
- Likes
- 40
FetteredChinos
Veteren member
- Messages
- 3,897
- Likes
- 40
yup, looks like it is priming itself for another drop.
hidden divergance on the 10 min chart implies that the recent "upwards" action is no more than a pullback.
i think this "hidden divergance" is similar to CM' s measurement of a move according to the relative RSI strength.
eg higher high in RSI, but lower high in price. indicates more weakness. usually
in theory. 😱
FetteredChinos
Veteren member
- Messages
- 3,897
- Likes
- 40
they are really trying to defend 10,000 arent they.
knocked on its door several times already. bounces up from it getting weaker each time.
gonna explode soon.
which way though......
knocked on its door several times already. bounces up from it getting weaker each time.
gonna explode soon.
which way though......
trendie
Legendary member
- Messages
- 6,875
- Likes
- 1,433
FetteredChinos said:they are really trying to defend 10,000 arent they.
knocked on its door several times already. bounces up from it getting weaker each time.
gonna explode soon.
which way though......
Will the 10,000 break be the 7pm kicker ?
fairly unconfident testing of the level.
maybe they need their big lunches before the final push ?
have initiated a sell at 10,009 ( just in case )
stop-loss at 10,100.
tradesmart
Experienced member
- Messages
- 1,286
- Likes
- 22
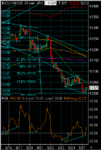
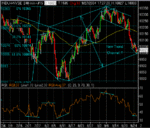
Nice PD in place on the 60 min chart and my ‘guess’ lower trendine from last week is acting as a firm anti-bear barrier at around the 10k mark as foreseen/predicated and rabbited on about last week……
Oil is very likely to retrace this week imho having retested the highs….
You all know what this means don’t you………?!
😕 No......?
Oil is very likely to retrace this week imho having retested the highs….
You all know what this means don’t you………?!
😕 No......?
Attachments
FetteredChinos
Veteren member
- Messages
- 3,897
- Likes
- 40
you a bullish bunny TS? shame on you 🙂


