Clown's 2007 outlook is work in progress

niet gokken .......

Danontje,

The last bit you are referring to is on the AEX data beyond the 534,04 since that’s the main differentiator in the two (a and b) possible scenario’s for the complete count starting at 563,98. Elliott Wave in my view should focus on the scenario that you will end up with and that will always imply you carry with you a number of alternatives. You will have to realize that each and every data Tick you add in your data file a new Elliott Wave Analysis should be done with a potentially different result.

If you run an analysis you will get many different possible scenario’s and if you strike it lucky one of those might be the one you will be ending up with in the end. Since the futures run now and the suspected opening is seriously lower you might skip a few options. However if you skip to dramatically you might be in for a nasty surprise trading that’s why I just focus on the 534,04 so I can not be surprised this week when trading.

To be perfectly straight the suspected opening is no surprise the more thrilling part is what the close is going to be like this afternoon.

EDIT:
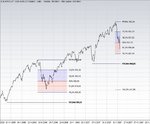
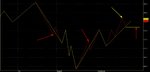
The current preferred scenario for the 534,04 count would be a third wave at 515,08. If you are reading Prechter you should be able to figure out what reference target to use for the fourth wave and where you should adopt an other scenario.

EDIT:2
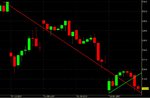
It’s awfully quit at the western front so just let me update the chart we started this week with.
 

Attachments

  • aaa.jpg
    aaa.jpg
    201.9 KB · Views: 188
Last edited:
losse flodders en hersenspinels

Must say I'm following your contributions with great interest Clown.
As stated, I'm just starting to read on Elliot and so have a very limited scope of things.

I combine Prechter with some Mensa mindgames that Constance offers and then try and look for reallife examples.

First and foremost though, the recipe I gave earlier just gave off a long-signal!
Will be very interesting to see what price is going to do the next few days.
Retracement is expected to end at the MA (20) according to the recipe. But we'll see what price cooks up.


Also, it looks like price has formed an inverted hammer, right on the MA(200). A significant average-level the last correction feb. -march


As far as Elliot is concerned, all I can do is give the one scenario I've read about and write it down as 'an option'.
I would go for a corrective wave A-B-C starting from 563,98 ; and say we're in wave C now, starting from 534,04. A wave C also goes nicely with the current psychological mindset that is mentioned by Frost and Prechter.

--Binck for some reason says it has no chartdata available, sorry.--

The wave C is motive (5 subwaves) but not impulsive ; subwave 4 enters the price territory of subwave 1.

My best and only scenario would be a far-fetched one I guess and suits my own beliefs a little too conveniently. Still, given the limited knowledge it was the only one I came up with.

With a little effort, it is possible to 'see' and construct an Ending Diagonal with the 5 subwaves, with subwave 1 starting at 534,04. Each subwave is then divided into threes. The 5th subwave falls short of target and is truncated.

Both the (falling) ending diagonal and truncated fifth subwave as part of a higher degree correction down, would signal a potent move up soon ; thus nicely corresponding with the signal my previous explained selfmade artwork gave me and the apparent inverted hammer.


--

I am not entirely sure I made a correct count; after all, if you have a hammer, everything looks like a nail.
But that doesn't stop me from having fun!

Cheers,
Daan
 
Last edited:
Dinsdag 7 augustus

This weeks focus of attention is on the GJN scenario so let’s take it with us today as well since nothing changed its still valid and the positive divergence might even be seen as an other confirmation. The Tuesday close levels have a slightly different meaning since a close above 516,68 is a buy signal. A close between the Monday close and above 514,28 is yet an other positive divergence. And a close below 514,02 is changing one of the essential pieces of the set-up with new references 507,92 and 494,98 when the AEX slips intraday. Mind you probably not for Tuesday however the intriguing thing is that once the AEX is rising for a couple of day’s those reference values will drop (?!).

The Monday close was outside (below) the descending trending area which normally does not last very long so I am looking for clues like candles and volume. The Yanks have a similar footprint in the chart although the DJIA remained perfectly within the descending trending area and now finds resistance in the 13500 area. So from a trending point of view both AEX and DJIA will have to escape the descending area by forming a upward one by taking down a number of resistance levels.

Elliott Wave Analysis like any other technique used for trading also has its weaknesses and I feel that at turning points Elliott Wave is not the technique providing the best signaling at its very best one could notice an increased number of contradicting scenario’s. Also the technique is an ultimate fractal based technique and the wave degrees are based on each and every wave of the other degrees both up and down(!).

This week we started with the 534,04 pivot and I therefore I updated that chart. Now I am going to add the 515,08 pivot to that chart as well.

Have Fun trading to WIN.


EDIT:1
If you have read the yesterday’s post you should have noticed that I mentioned something about a wave 3 which implicitly has something to do with the number 4. Mind you this would now be in the overall 563,98 picture due to the actual events beyond. A wave four retraces typically 38,2% (EDIT: oeps sorry mistake that’s 23,6% of course) of its previous wave and in more explicitly trending markets might only retrace 14,6%. Now you will need the fine tuning tools.

EDIT:2
The most challenging thing is the synchronizing of the used techniques and put them into perspective. This evening doktuh Ben is going to do one of his tricks again and without even thinking for a minute what he is going to say the way the market will respond that’s the issue and nothing else My bull/bear influencer prefers a scenario down towards the Doktuh’s words and a positive market reaction. So my main issue will be what our (AEX) opening tomorrow looks like more specific within the overall picture. So no gambling.
The updated chart is attached.

@Danontje
Not so fast switch off your emotions and think or read first than think about that third wave and where you have hide the first and second one (?!). Than go to the next step and look at that wave starting at 515,08 and see if you can make something out of that bit.

II@Danontje
Well this is what I have been telling you for some time now, the more knowledge you obtain the more complex things will become, you need to adapt process thinking and take it step by step. My first thought counting the 563,98 bit would be wave 1 555,63 wave 2 561,17 if I would prefer a five-count presently. So the “potent” wave 4 would have scored its target when considering this whole wave is quite negative and you also will be needing the first wave in order to calculate your first target for your fifth wave. If this is the scenario we will be ending up with it would implicate a rapid completion of this one and we can concentrate on the next move. However one of the reasons I urged you to also study the bit beyond 515,08 can be found in the Rule of Alternation. If you will take in account today’s high and look in your chart you will find that the Yanks push down did meet in fact the 61,8% retracement level. From a trading point of view your calls for this trading day.
 

Attachments

  • aaa.jpg
    aaa.jpg
    228.8 KB · Views: 188
  • aaa1.jpg
    aaa1.jpg
    217.8 KB · Views: 177
Last edited:
Stating the obvious

Assuming wave 3 was 563,98 --> 515,08; thats 48,9 points.
Wave 4 would then be:
14,6% ; 515,08 --> (515,08 + 0,146 * 48,9) = 522,22
23,6% ; 515,08 --> (515,08 + 0,236 * 48,9)= 526,62

It seems 522,22 is valid.

If then wave 5 has now started it would be expected to surpass atleast 515,08.
Been looking through Prechter for the mentioned fibonaci retracement/extension values of the waves relative to eachother .. but havent found the numbers yet.

@Clown: Right, taking a pen and paper now. Cant see more than 4 days back with Binck and the computerscreen is turning my eyes square. Besides, just read Constance is a fan of pen and paper too, as the computerscreen apparently isn't square. I'll get back to you ;-)
 
Last edited:
Lost in translation...

Must admit I'm a bit lost at the moment. Cant really place the latest events using Elliot.

Revised:
5 (sub)waves started at 563.98 pivot.
wave 1 : 563.98 - 523.76 (value could be wrong, only have EOD data)
wave 2 : 523.76 - 534.04
wave 3 : 534.04 - 515.08

Now wave 1 resulted in a 7.67% pricedrop and wave 3 in a 3.68% pricedrop.
For the subwaves to be impulsive, wave 3 cant be the shortest and wave 4 cant enter the priceterritory of wave 1 (=>523.76 < 536.98).


wave 4 : 515.08 - 522.08 (allowed)

wave 5 then cant produce a pricedrop greater than 3.68%, which results in a target of => 503.54
Wave 5 ofcourse implies an A-B-C pattern after completion, which I'm sure would then more than satisfy all the W-believers.


To be honest though, I'm not satisfied with my placing of the movement from 515.08 up and current move 522.08 down. Perhaps its better to temper my enthusiasm and finish reading first :)

So dear Clown, if the above is not what you meant .. I'd feel a bit burdened wasting your time. No use giving hints if I cant understand them yet :)
I'll then tactically retreat and re-appear better educated.

Speak of the devil! Doorbell just rang and delivered Murphy!
Murphy, Prechter and Constance seem like a good basis.

Cheers,
looking forward to your and especially the AEX's contributions

--

EDIT: 1
@Clown,
I do believe I have a general 'feel' for the direction at the moment, though much of it comes from my previously mentioned recipe as well (see attachment).

Went long yesterday (one day late) as in accordance with system. This due to the fact that I couldn't yet verify anything with Elliot.

Basically, my feel is that the impulse down is finished and the AEX is allowed to take a breath. This breath might be wave A (and depending on the count for a completed 5-waver from 563.98 --> 515,08 ; I'm looking at targets of 532-536)

The precise pattern of retracement (zigzag, flat etc.) is for now, beyond me.

The 'suggestions' of my crude system (retracement wont advance above red MA(20)) seem to allow room (via extrapolation) to about a max of 535 as well ; taking into account these last few after-correction retracements have typically lasted about 5 days.

Furhtermore, the last few retracements after corrections advanced up to about 15-20 points of the MA(200) ; indicating a target of around 530.

Another note is that it is actually the pricescurve[dayhighs] that touches the red MA(20) ; EOD doenst have to come that close.

In other words:
  1. Since I dont have a definitive clue about where exactly we are in the market, it would be a wise idea to get out untill I do.
  • However sloppy, the signals and my interpretation point to a limited upwards potential on short term, so I'll be closing my longs (nice profit) somewhere today

EDIT: 2
Short term gifts (prematurely?) unwrapped.
Frees up some time to now enjoy the sun in my garden and read on (Murhpy is extremely easy to read). Hopefully also creates the detachment necessary to make an objective analysis.

EDIT: 3
@Clown,

Very nice. I was mixing up your red- and blue degree waves and therefore getting into some trouble around third red wave. Does seem I was on the right track in that specific scenario. Kudos to you for seeing the pattern and putting it in a chart with such detail (minuette even?) .. all my computer has for Elliot is microsoft paint :-(

P.S. Interesting time-intervals with the candlesticks.. it aint 15, nor is it 30. Or maybe Binck is just messing things up ;-)
 

Attachments

  • AEx88.JPG
    AEx88.JPG
    56 KB · Views: 177
Last edited:
Woensdag 8 augustus

Counting Elliott Waves is something else and you always will have to carry with you a number of alternative scenario’s, when trading you will have to understand the critical area’s of the most relevant ones. The Tuesday high was exactly in the area of a strongly trending fourth wave however the potential fifth wave did not manage to take out the 61,8% retracement so we now should also look at the option 563,98-515,08 is a completed wave as the waves beyond 515,08 are starting to form shape. However first things first and you should be able to figure that out with the provided background information. Remember Technical Analysis is all about conditioning so when counting waves utilize what’s being offered.

In Yanks Land the DJIA did not manage to take out the resistance level in the descending trending area and closed right below this level.

Have fun trading to WIN.

EDIT:1
The AEX has arrived at an important crossing, a crossing time/price wise where decisions are due that effect the intermediate future direction. It’s not unusual to see the asset move impulsively at those crossings so it’s required to focus. Some would say the answer is blowing in the wind and in an attempt to force the answer would start blowing in that wind.
Tough call since once again it seems Yanks Land will have to force things for us by getting that resistance area down, in the main time we will have to watch our support area’s like a hawk. When I read my indicators correctly, mind you this is extremely sensitive so please allow some level of tolerance, the Yanks might push us towards those support levels before showing its true color.

@Danontje
Something like this one?
 

Attachments

  • aaa.jpg
    aaa.jpg
    210.9 KB · Views: 184
  • aaa1.jpg
    aaa1.jpg
    240.8 KB · Views: 209
Last edited:
Donderdag 9 augustus

The AEX has arrived at an important crossing time/price wise that effects the intermediate future from a trending perspective so you witnessed a level of volatility which is above average. This might continue for a while before back testing the taken hurdle and the larger the price/time force displays itself the better chance the back testing is successful.

If you take the different Elliott Wave counts we have covered you notice that the three wave scenario with wave 3 at 515,08 hit it’s fourth wave 38,2% retracement level at 532,84 (okay fair enough it missed by 0,01 index point). The other scenario which has a completed 563,98 –515,08 wave has the first retracement level at 533,76 and I trust you will be able to figure out the other ones when required. So the most interesting bit for now is the wave starting at 515,08 and that’s a bit of a challenge so I think I better pass at the moment and wait until the present wave has been completed.

The infamous page from the book should be kept close as well.

Have fun trading to WIN.
 

Attachments

  • aaa.jpg
    aaa.jpg
    285.6 KB · Views: 166
[backstreetboys theme] ... AEX, I wanna feel you up and down

Be it a completed wave four at 532,83 or possibly completed wave A ; general direction would be down.
(though that is ofcourse a bit late to note right now)

A wave 5 down would be travelling down quite a bit and not of my concern, because I want to know about the possibilities (dangers) up.

Wave A could be part of a zigzag or flat (subwave from 515,08 up can be interpreted as a five, but a three also).

If it's a zigzag, you would expect a rather modest wave B to end at the previous fourth subwave (525,46).
If its a flat you would expect a hick-up at either 525,46 or 517,62 (end subwave 2) ; not too sure how to count.

Doesn't matter though. If the viagra bounce fromk 525,46 up nears/tackles the previous top we have a zigzag.
If the viagra bounce, doesn't bounce at 525,46 or does so rather unconvincingly ; I'm leaning towards a flat (possibly extended, depends on overshooting said targets)


More possibilities do exist ofcourse, but at the moment just stating the options that I understand and/or fall into the picture my ' recipe' gives me.

Cheers,
Daan

EDIT: 1
Rrrr, just realized I dont really have a scenario up, though my recipe doe still entertain some potential that way.
I'll just watch and learn ;-)

EDIT: 2
Not that convincing, but fun enough to paint.
 

Attachments

  • AEX987.jpg
    AEX987.jpg
    47.3 KB · Views: 197
Last edited:
Vrijdag 10 augustus

The correction so far is following the defined path Technical Analysis provides although the swings up and down are substantial intraday they fit within the trending area boundaries, a few minor slips aside. To continue accordingly the perfect fit would be a price swing upwards or a couple of day’s sideways upwards. The Technical Analysis New School target fits within what has been named the GJN scenario and could also benefit from a similar price/time action as displayed in the shopping items Viagra indicator which has dropped close to zero. The far most underestimated parameter in Technical Analysis and how it effects the used indicators is the factor time. The best example I can think of is the old school Flag which is basically a price moving sideways in time and if you study what it does with your used indicators you should get the picture.

The Elliott Wave count focus shifted to the 532,83 pivot and just eyeballing the events beyond that pivot should tell you a number of things. Just chop the data into portions and notice that the bit from the pivot to the day low can be divided in three pieces even though the third bit is short if compared to the first. If you “channel” the thing by connecting the pivot by what should be wave two and parallel a line starting at what should be the first wave. Just do it and you should get the picture.

The Yank’s Land correction so far is also within the trending area boundaries although there is a difference that might hit us today or Monday.

Have fun trading to WIN.
 
when in doubt.....

The Elliott Wave count focus shifted to the 532,83 pivot and just eyeballing the events beyond that pivot should tell you a number of things. Just chop the data into portions and notice that the bit from the pivot to the day low can be divided in three pieces even though the third bit is short if compared to the first. If you “channel” the thing by connecting the pivot by what should be wave two and parallel a line starting at what should be the first wave. Just do it and you should get the picture.


Dear Dutch Clown,

Still trying to understand some of the waves but difficult without the right program. Maybe one day......

Is the attachment a bit like you meant?

Have fun, also on "the other side"

Kvkd
 

Attachments

  • AEX UUR 04.gif
    AEX UUR 04.gif
    22.9 KB · Views: 181
Look for the differences

I know I can learn from the past, but I never would have thought it could fit as a Chinese copy.
Pacito
 

Attachments

  • junaug.JPG
    junaug.JPG
    88.8 KB · Views: 265
Week 33.

The present correction is now serious enough (price wise) to influence the long term Elliott Wave count in the wave level starting at 217,80 as suspected for quite a some time, I can not emphasize enough to use several options counting waves in order not to miss the one that’s going to survive at the finish. The 563,98 at this stage has a preference for the label three within an impulsive wave that has three options that basically have to do with price and time for the last wave. Well and this is probably one step too much at this point in time since the fourth wave is already labeled on the 497,79, the Friday low in this scenario option. So the question mark in its full glory is on the 563,98-497,79 movement, is it or is it not (yet) a completed fourth wave.

In the chart the above wave count looks pretty – the second wave is quite symmetrical to the potential fourth wave however the implication this has for the fifth wave do not match other analysis work - so let’s take out the calculator to find the relevant fourth wave price references in order to obtain the objectivity since the eye is a misleading instrument; 14,6%= 517,81 23,6%= 489,34 38,2%= 443,17. If we do an Elliott wave analysis on this wave the present preference is a wave which has not yet been completed so the focus of attention this coming week (33) is on the relevant retracement levels. Also the last referenced pivot 532,83 has a preference for a lower low so we start this week by looking at the pivot 497,79 first and reference it towards the 532,83 pivot.

If we compare the actual correction to date to the 2007 projection worksheet the simple facts are that the actual correction is price and time wise faster/shorter than the projection. The worksheet has a July – October correction of 20,44% where as we have approximately mid August an actual 11,74% correction. Mind you I am not concluding we are only halfway it’s just one of the scenario’s one will have to deal with, after all there are similarities and also differences.

The GJN taught trending methodology remains to trend positively and given the tolerance allowed within – see last weeks postings – I continue the fine tuning route I have started some time ago, the critical GJN scenario level on Monday is 499,35. From the trending area side it has to be mentioned that the AEX is well below the negatively trending area whereas the DJIA managed to stay within although the lower boundary was at the 13100 level. Let me swing it both way’s not to confuse you just something to think about; if the AEX is to meet the same level as the DJIA that would be around the 520; if the DJIA would meet the same level the AEX is at that would be around 12800.

Have fun trading to WIN.
 
week 34.

Last week we have looked at the overall picture fitting in the movement starting at 563,98 the findings are still valid so this week we just look at that specific wave count down. The preferred scenario is a pattern called ZigZagC with the third wave (C) starting at 532,83. The first two targets of this wave have been met and the two left are 460,12 and 415,18 just to get some idea about this scenario. If you study the third wave you will find additional wave counts within the wave we call sub wave counts, I will not cover them and just give you the relevant pivots, 515,34 and 506,90 since these play the goalkeepers role for that scenario this week.

The interference by the FED caused some serious movement last Friday from a relevant support line which had been tested right after opening and again before the interference. Many resistance levels could not perform only the one corresponding with the support did function as resistance. So this weeks focus of attention is on how effective or sustainable the interference really is by looking at the resistance levels. If you look at the 479,49 – 506,90 wave the best scoring pattern is a completed ZigZagC however let’s first watch the Fed effect leftovers. The 563,98 – 479,49 has an interesting internal wave time relationship and could be considered completed time wise so that would imply the wave starting at 479,49 will have to turn preferably into an impulsive wave rather than a corrective one.

The Long Term Trend can be related to the 217,80 March 2003 pivot and I have carried two alternatives with me for this LT trend, the first one has arrived at the support both time and price wise , the second one has the time and price downwards potential to fit in the described scenarios imply. The beauty of the two is that when they are combined there can be generated a negotiating margin in both price and time by those boundaries it will be decided which of the two will be the actual route the AEX takes. The Medium Long Term Trend can be related to the 307,31 August pivot and the AEX closed last Friday right at the boundary of this MLT trend spiking out of the trending area intraday. When the volatility we have seen lately continues the so much resented pause might be swiftly replaced by a decision which route we will take for the next move.

Someone told me to focus on resistance levels in a negative trending market so this is precisely what I am going to do by derivatives of the above mentioned pivots.

Have fun trading to WIN.
 
Dinsdag 21 augustus

It should not come as a surprise to you, the AEX played with the relevant resistance level on Monday and did not succeed to force a decision either way and given the Friday price move also should not be a complete surprise since the time/price matrix was externally forced and had to find balance again. An other piece of information in your chart you just can’t miss so don’t ignore it is the page 58 situation which by the actual recent events is more than explicitly relevant.

Given the GJN taught trending methodology it is apparent to not look randomly for candle stick patterns but to use them within the trend as and when appropriate so an inverted hammer candle in a negative trending market close to both resistance and within the bear range definition. Well what can I say.

Have fun trading to WIN.
 
Ach zeg maar niets meer.....

From the Analysis point of view the paradox is, less is more and more is less however the AEX fails to do both so within the given trending boundaries short term trading is a blast providing you take the money and run. Or use so called “premieslurpers” with “hekkies” just waiting for the things to come without any risk.

The Long Term calculation exercises for a wave 4 and the 2007 outlook reference (see above posts) are still valid. The wave internals have changed and are presently in favor of an A or W at 479,49 and a B or X at 521,21 awaiting confirmation or cancellation due shortly.

And just as one gets really bored the exciting TA conditions appear in the charts, the more generates the dark red potential again. However the AEX has arrived just above the bear and bull crossing which opens the door to the next level which is the 531 area so the next couple of trading days are going to tell us if the 521 level sticks (even slightly higher than the 521,21) or if we are moving to the next level.

In Yank’s Land the DJIA has something with the 13350 area so have fun I would say.


@Pacito
Right now the TA conditions are pointing at a seriously dark red scenario which is even more red than the Alle Mannuh nie lulluh maar… UPG scenario. The capturing of the 521 level and moving on to the next just changes that and still will create a dark red scenario in between the above mentioned two also depending on the involved elapsed time. One of the first references is what the Yank’s will do at the 13350 level this evening.
 
Last edited:
Is it a rollercoaster, or isn't it? In two days from 503 to 518. Al that in a way that would suit a drunken driver. Not that I'm complaining. It all came to timing. What's next? RSI is still in bear territory. The bullrun today was too fast to comply with time. So I see a retreat tommorow. 515 would be normal, but in the exagerating state we are it could well be 512 again. The only thing that shouldn't happen is breaking 521. In that case I have to reconsider again.
Pacito

PS Clown. Simple question, simple answer: the yanks didn't do anything at the 13350 level. They didn't even come near. So I suppose they remain also in negative territory.
 
Last edited:
Week 37.

The AEX last week arrived at the next Fibonacci retracement level and like the previous one after some hesitation the festivity of Technical Analysis Recognition once again was complete. And back to business as usual which means the resistance levels within the 531,75 KISS trend process or if you can adapt the more sophisticated trend identification methods. Friday the first bear treasure room was entered again by crossing the 522 area downwards the second bear treasure room entering the last time woke up the FED to do something causing the recent spectacular effects. The second treasure room entrance now is somewhere around 492 whereas the present Technical Analysis results point to a price target in that second treasure room below the previous low.

First things first and that’s the 531,75 trend which has to continue by remaining within the resistance boundaries on the Short Term charts which on Monday are 523,50 – 526 the related down target/support in the same chart is 511,50. Mind you the bull scenario is not completely vanished since the Friday low might very well be labeled the fourth wave of a TripleZigZagC pattern providing a 546 target for the fifth wave. The three things to watch are: a) the trend continuation b) the second wave level c) the actual wave internals.

The Astro Analysis people had their party as well since September 7th shows a hit for Rule number 2 from Mr. G. Bayer his collection of trading rules. Not particularly my favorite as his Rules appear quite frequently and I have not yet found the solid prove that result is what it should be. In fact the high frequency of signaling is my main objective so given the nature of how those signals are generated I am convinced it’s just a part of what one should be looking for. Anyway fun it was/is.

The GJN taught trending methodology tells you the AEX is trending negatively and that’s the reason Mr. Nikken is more interested in finding old school patterns close to the resistance area’s. If you care to perform some quick and dirty inter-market analysis you find that the main indices in Yanks Land are trending positive using the very same methodology, and even our German neighbors main index the DAX is trending positively. So my teaser question is, has the AEX become the world leading index? LOL.

So I better use my own trend identification process which tells me the DJIA crossed it’s primary descending 14021 trend line last Friday and will be looking for support/pause just above the 13000. In a perfect world back testing resistance and than moving on downwards in line with the Technical Analysis New School target. When the Yanks are there the analysis excitement starts, at this point in time there are too many options to speculate given the whole picture.

Have fun trading to WIN.
 
Tellen?

A few day's ago I posted my counting on a dutch forum. Somebody with a red nose and orange hair asked me about the fourth wave due to the first one. Could I be wrong? Well I did some homework and fabricated an other one. This one fits better in the overall picture.

Please give me some comment.....

Success,

Blinker
 

Attachments

  • fti fibo okt.gif
    fti fibo okt.gif
    30.6 KB · Views: 237
Top