You are using an out of date browser. It may not display this or other websites correctly.
You should upgrade or use an alternative browser.
You should upgrade or use an alternative browser.
Clown's 2007 outlook is work in progress
- Thread starter The Dutch Clown
- Start date
- Watchers 26
20070717
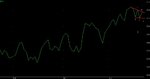
Today was my cup of tea. What was it about the shape of the index forming a cup? Followed by a raising index or a racing index? RSI is nice at about 64 so there's room on both sides. No nasty PR's and so on. Only a long term ND, but I decided that that has no specific meaning so I won't look at it. As long as Al Gore is removing the CO2 out of the balloon, the thing will get lighter and float or fly higher.
Happy trading,
Pacito
The Dutch Clown
Established member
- Messages
- 592
- Likes
- 11
Het zal wel aan de vakantieperiode liggen....
Your guess is as good as mine so let’s please skip the guessing part and just focus on what the charts are offering. The Bear minded people are awake since we had no new multi year high last week and we closed at the weeks low. Using your K.I.S.S. trending methodology showing you a series of lower highs and lower lows would confirm until proven otherwise. If you by now have learned something about Technical Analysis New School you should be aware of a number of alternatives.
In Yanks Land the DJIA has created similar charts, so the AEX just needs to confirm on Monday morning, preferably the ideal signaling however I will utilize what’s being offered. Nothing more nothing less.
Every once in a while an individual without any clue has the need (or should I say frustration) to question the use or function of Technical Analysis(TA). Basically the fact that the individual has no idea what TA is about disqualifies him or her to debate and even judge. The joke in fact is that all the things which TA is definitely not are dragged into the debate so anyone with only some basic knowledge just smiles. The expectation level seems to exceed the Holy Grail level and such a thing does not exist.
In trading or investing which is if you come to think about it trading with less decisions moments, TA is just a tool in your toolbox and tools are the things you work with which is probably the challenge, the working part. So stop nagging about the value of TA in trading and go to work since an exciting week of trading lies ahead of you, once again.
Have fun trading to WIN.
janebowles
Junior member
- Messages
- 21
- Likes
- 0
Everybody down the drain?
Pacito
No, but there is no longer life in this thread. I like to read your postings as well in the
Koffiekamer of the IEX.😱
The Dutch Clown
Established member
- Messages
- 592
- Likes
- 11
met een lekker bakkie koffie erbij gewoon weer een nieuw week plannetje maken.
Out of this weeks options in our trading roadmap the AEX picked the preferred one however that it would be so outspoken is like a cherry on the “appelmoes”. It has been said numerous times already the price will not follow a straight line towards the target and that will even increase the actual P you will get out of the swings if you play those as well.
The distinct difference between the Analyst and the Trader once again shown in it’s full glory. The Analyst could not care less if his found turn is in fact a turn or a pause. The Trader uses the found turning points to avoid since money is made in between the turning points as a sure thing as appose to the gambler.
The events at the Dutch forum recently have a history more than a day but one obviously can not expect the screamers to think even once. Given the level of screaming I resent the thought that some of them might benefit even marginally by the results of my contributions. It’s just a lot of fun watching the “better” part of the community on the soap-hill and the best part is yet to come.
Have fun trading to WIN.
janebowles
Junior member
- Messages
- 21
- Likes
- 0
I am still looking at the third attachment of your 391 posting and I must say that the index behaves admirably in conformance with your outlook/work inprogress. My "chapeau" for that. I was wondering if your outlook for the second half year is still
similar to the projected one.
@ Pacito: Thanks for pointing at the Beurscontent-site. Indeed, it is a relief.
😛
similar to the projected one.
@ Pacito: Thanks for pointing at the Beurscontent-site. Indeed, it is a relief.
😛
The Dutch Clown
Established member
- Messages
- 592
- Likes
- 11
Een nieuwe week geeft een nieuwe ronde met nieuwe kansen.
Well JaneB,
The thing with long-term projections is that even if you succeed to manage the same level of tolerance as within your short-term or scalp trades (which presently are facts due to the time nature), in absolute value both time and price tolerance is a bit to large. And I can’t emphasize enough that Analysis and Trading are two extremely different area’s of expertise and ideally the combining of the two should be played. In fact if you have read the Friday thread on the Dutch forum and in between the chips found the diamonds you now know how you can built up a trading position at no cost. The only thing you will have to do is some thinking and a bit of working. I always did fancy the clever bits so the thing is not being right but making money.
As stated in January, the 2007 projection is work in progress if you think of it as a bus ride you make a plan for a number of bus stations and if you pin yourself down to somebody’s picked number out of the blue by the end of the year you might be in for some surprises. The thing is that this is my first go at a year’s projection in such detail and I am still learning to improve the underlying theory and techniques so therefore I can only consider it workable when it is consistent, based on actual performance (which is more than six months). Well here is my challenge, time, in the sense of the inverse meaning of the statement “ past performance is no guarantee for future performance”. One thing is for sure if you don’t start you will never ever get anywhere and that’s yet an other issue since there is nothing out there written down to use only some clues from a wide range of sources.
Just look at the level at the Dutch forum. The expectation level some people have is outrageous and confirms that they have no clue whatsoever. There is no Holy Grail and the glass ball on my desk just shows my face with the red nose. However my broker continues to increase the flow of money to my and the other circus members spending accounts. If you don’t understand how a published conclusion has been generated you also will have no clue whatsoever when that conclusion become obsolete. When your beloved analyst incorporates a number of assumptions and you fail to identify those you are in for some nasty surprises.
Have fun trading to WIN.
The Dutch Clown
Established member
- Messages
- 592
- Likes
- 11
Donderdag 2 augustus
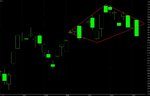
The shopping bag is positively trending and since yesterday we have been loading it with items from our shopping list. Just now the items turned positively trending so they can remain in the bag until either the stop-win is hit or the reduce button. I have included the main stop-win line.
Have fun trading to WIN.
EDIT:
There are many different way’s to identify something we call a trend, all of them have pro’s and con’s so you need to carefully study both in theory and practice what those are. The pro’s are things you can work with, the con’s to however differently and those also offer room for improvement or if that’s not possible you might find alternatives you use for cross reference purposes. Don’t start with the more challenging methods, use the straight forward ones first and accept the slippage just work on them with discipline for a while to built both experience and confidence.
@ Pacito
Thanks the trade was entered Yesterday morning close the an AEX value 520 and the main shopping bag is trending positively according to the GJN taught trending methodology. It’s somewhat scary to enter a Long position when the world is falling apart according to the media however since they lack quality it might very well be considered the ultimate Long signal. To cover the downsides of the GJN taught trending methodology I have implemented a number of homemade toy’s and one of them has generated the first confirmation. This afternoon my money management allowed me to scalp against the trend which has created an even larger margin or safety zone if you like. And last but not least the close today was above the 519,04 Pietje main line. Mind you I am not (well yet anyway) telling you we are heading towards a new multiple years high it’s a journey with defined steps secured by exit and more importantly the entry was the fun part.
@Danontje
You will have to understand the basic concept of enveloping techniques and BB just being one of the flavors. The main objective is to capture the underlying asset with a glove if you get the picture. As Pacito explained John B himself did find that if the bands narrow an acceleration of the asset might be expected however there is no clue whatsoever about the direction although John B found quite a few false moves before the actual move. So one of the things you might want to implement is measuring the bandwidth and tune it in such a way that you generate a warning signal when moves are due according to this technique.
A totally different approach in enveloping is the use of MA’s like I have shown you. This is a delicate piece of work which involves a huge amount of scaling and testing on the asset. The objective is to find trending parts of the asset as opposed to the non trending parts. And one of the benefits this approach is offering is direction as well. Since I use a few other techniques as well I am able to filter(read fool) the settings a bit in such a way that they are in sync with findings from other sources. What I am currently playing with is to let this technique generate multiple level support and resistance levels that function as potential turning points.
As the RSI is concerned you know my position on the old versus new school as written down in the GJN articles and the book. On top of the suggested derivatives I have built a number of homemade adjustments and still have a number of idea’s that will have to be implemented sometime in the future. In my view the ADX is primarily targeted to identify the strength of a trend and I feel there is not that much decent study work, or at least I haven’t seen it yet, done. I have played a bit with divergences but that does not qualify for solid work on the subject.
Attachments
Last edited:
MA-ke my day
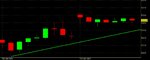
I've been tinkering around with quite a few 'averages'-derivatives such as MA (xx), Bollinger Bands and Enveloppes.
Combining them seems to generate quite valuable information in the speficic situation of a relatively large correction (+/- 10%)
As Clown pointed out on another forum, the generated 'artwork' of colourful lines is far from perfect and still missing something. That 'something' in my view is the trend. Considering the trend is very important and even more so when dealing with averages.
Why?
It's only logical that in a downtrend, when a given average is declining, price will be below average more often than above. If not, it would not be declining.
Uptrend vice versa.
Just the last few days a rule of thumb generates reasonable intraday signals just with a simple MA 20. The rule of thumb is that in a downtrend, price doesnt move up more than about 2 points above the MA, and uptrend vice versa.
Too simple ofcourse (since the MA could just as easily rise/fall to the entry target instead of price moving towards the MA), but a good basis.
For the longerterm: (months and EOD-data)
At the moment, I try to use RSI and DMI to get a feel for the trend.
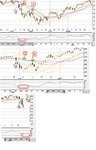
While tinkering I stumbled upon quite an interesting pattern occuring at larger corrections. Attached are two examples to illustrate:
*March - june 2006
*Jan - March 2007
*October-decembre 2006, the pattern also occured but slightly less clear due to it being a smaller correction (indicators reacted too slow)
Right, the pattern:
start pattern ; price dives
I. BB's open up and enveloppe-boundaries turn downward and inside BB's
sign end price dive, start retracement upwards
II. MA (blue) crosses MA (red) upwards. RSI at bottom (and DM- sharp upward tops)
sign end retracement, extension downwards
III. price reaches/nears MA (red)
--
It's quite useful.
You'll be too late to recognise the initial correction, but on time to be able to validate a possible start of pattern.
Next signal, wait for MA's to cross ; validate through RSI at bottom and DM- upward top.
When that happens you'll be on time to act and take a long position for as long as the retracement lasts (MA [red])
Around MA (red) you'll be able to take a short position again.
Note: there are occassions where price simply passes through the MA, though usually not the first time. Still working on a good validation.
The reason for my posting is ofcourse the hope for some feedback and possible improvements. I've left out indicator-values on purpose, so I dont influence you too much already. If you're interested in trying/testing this try and tinker for yourself (not that hard) and find the best values.
I post this now because a pattern has formed and should be generating signals soon. That will be a real in situ test of its use.
Wait and see 🙂
P.S. Eew, ugly graphs .. will try and post better ones soon
I've been tinkering around with quite a few 'averages'-derivatives such as MA (xx), Bollinger Bands and Enveloppes.
Combining them seems to generate quite valuable information in the speficic situation of a relatively large correction (+/- 10%)
As Clown pointed out on another forum, the generated 'artwork' of colourful lines is far from perfect and still missing something. That 'something' in my view is the trend. Considering the trend is very important and even more so when dealing with averages.
Why?
It's only logical that in a downtrend, when a given average is declining, price will be below average more often than above. If not, it would not be declining.
Uptrend vice versa.
Just the last few days a rule of thumb generates reasonable intraday signals just with a simple MA 20. The rule of thumb is that in a downtrend, price doesnt move up more than about 2 points above the MA, and uptrend vice versa.
Too simple ofcourse (since the MA could just as easily rise/fall to the entry target instead of price moving towards the MA), but a good basis.
For the longerterm: (months and EOD-data)
At the moment, I try to use RSI and DMI to get a feel for the trend.
While tinkering I stumbled upon quite an interesting pattern occuring at larger corrections. Attached are two examples to illustrate:
*March - june 2006
*Jan - March 2007
*October-decembre 2006, the pattern also occured but slightly less clear due to it being a smaller correction (indicators reacted too slow)
Right, the pattern:
start pattern ; price dives
I. BB's open up and enveloppe-boundaries turn downward and inside BB's
sign end price dive, start retracement upwards
II. MA (blue) crosses MA (red) upwards. RSI at bottom (and DM- sharp upward tops)
sign end retracement, extension downwards
III. price reaches/nears MA (red)
--
It's quite useful.
You'll be too late to recognise the initial correction, but on time to be able to validate a possible start of pattern.
Next signal, wait for MA's to cross ; validate through RSI at bottom and DM- upward top.
When that happens you'll be on time to act and take a long position for as long as the retracement lasts (MA [red])
Around MA (red) you'll be able to take a short position again.
Note: there are occassions where price simply passes through the MA, though usually not the first time. Still working on a good validation.
The reason for my posting is ofcourse the hope for some feedback and possible improvements. I've left out indicator-values on purpose, so I dont influence you too much already. If you're interested in trying/testing this try and tinker for yourself (not that hard) and find the best values.
I post this now because a pattern has formed and should be generating signals soon. That will be a real in situ test of its use.
Wait and see 🙂
P.S. Eew, ugly graphs .. will try and post better ones soon
Attachments
Last edited:
I. BB's open up and enveloppe-boundaries turn downward and inside BB's
sign end price dive, start retracement upwards
II. MA (blue) crosses MA (red) upwards. RSI at bottom (and DM- sharp upward tops)
I looks like you did invent the wheel for the second time. We had quite a discussion about narrowing of the bollinger bands and the bands inside the BB's. But it seems you have a point.
Same for your second point.
Pacito
Attachments
Last edited:
Awh :-(
Ah well, I suppose there's very little original to construct with everyone using roughly the same tools; .i.e. the default club.
Where could I find this discussion? Is it somewhere in between the few thousand posts in this thread?
I'll keep pursuing this 'lead' and depending on how it works out in situ, make some adjustments. One thing is for certain, it's not a timeless-tool.
For instance, the described recipe doesnt seem to work in an extended longterm downtrend and the MA(xx)-values wouldnt have generated the right signals a few years back.
Now I dont have any problem with that, since I don't believe in the one great formula that predicts everything. Still, I'll have to find a way to make the recipe evolve.
What I'd like to focus on in general is the validation of ordinary signals. Just use simple indicators that give regular signals and identify the situation/environment in which they work. In essence, one level deeper than knowing when, which indicators are valid (RSI, etc.) would be to know when the signals they generate are valid.
No matter how specific the situation, if it works .. you only need one ;-)
Second point of interest is using indicators relative to eachother. One of my working fields of interest is spectroscopy (defining energylevels in atoms and such). Almost every single bit of data regarding these energylevels has been gathered by comparing different measurements. The most amazing pieces of information, which you would think are impossible to know, can sometimes be accessed by clever combination of measurements and relating them to eachother.
Anyway, I'll keep you posted
How much energy will you put in?
Interesting field you work in. Then its not so hard for you to compare different levels, have an electron jump to another level and enlighten you. One of the remarks you made about the 2 points from the MA sounds like a foton. Maybe that's the way to approach things as we humans are most of the times yes/no switches, or 0/1.
There's nothing default in using the same instruments in another way. I also know the alphabet but......... Sheakespeare?
Pacito
The Dutch Clown
Established member
- Messages
- 592
- Likes
- 11
Vrijdag 3 augustus
Some say it’s not wise to anticipate and one should only react, it’s not an accurate statement and the nuances are that you should ultimately anticipate about all possible scenario’s before you start trading/investing. If you have conditioned your scenario’s, trading is simply react to the asset hitting your conditions, that’s all folks nothing to it.
Language is something peculiar since it shifts however the completely raping of it is something that has always puzzled me. In the Dutch language the word “potentie” has something to do with the Male’s performance in bed the word “potentieel” however means potential which is something completely different. Now it really upsets me when I am watching the 8 o’clock news and some economist/analyst joker is talking about the Male performance in bed in stead of a market potential. It made me call my potential indicator “Viagra” to be able to scale how potent the asset is.
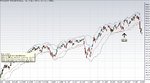
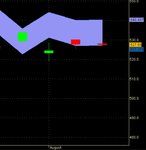
So on the first attachment you have the shopping bag potential which you might agree bares some upside potential in our positively trending modus of operandi. The second attachment is the potential of the items we have bought on Wednesday. Someone suggested Flag day yesterday. As mentioned earlier I repeat it again, Technical Analysis is no glass boll telling you exactly what’s going to happen, no Sir Technical Analysis is all about conditioning.
If one looks at the RSI as a collection of fractals it is also possible to project those into a price chart as I have done before. The third attachment chart you get provides some guidelines as to where you are.
Have fun trading to WIN.
EDIT:
Our Viagra indicator of the shopped items is not doing anything extraordinary today as you can see in the updated chart in attachment four. So it’s about time to have a peep at Yank’s Land as well; similar charts only the Yank’s did push the items trend up in the stretching sense which is a strong signal. However this is also a limited process and timing is going to play a crucial role this afternoon.
EDIT:2
Yank’s Land played its scenario and made us work this afternoon so now it’s up to them to play the rest as well. For the ones of you who play the GJN scenario do not (yet, sorry could not help myself) panic however if you can’t stand the heat, well basically you just have to catch up with your reading so you will be able to pinpoint the details.
Have a nice weekend and cheers.
Some say it’s not wise to anticipate and one should only react, it’s not an accurate statement and the nuances are that you should ultimately anticipate about all possible scenario’s before you start trading/investing. If you have conditioned your scenario’s, trading is simply react to the asset hitting your conditions, that’s all folks nothing to it.
Language is something peculiar since it shifts however the completely raping of it is something that has always puzzled me. In the Dutch language the word “potentie” has something to do with the Male’s performance in bed the word “potentieel” however means potential which is something completely different. Now it really upsets me when I am watching the 8 o’clock news and some economist/analyst joker is talking about the Male performance in bed in stead of a market potential. It made me call my potential indicator “Viagra” to be able to scale how potent the asset is.
So on the first attachment you have the shopping bag potential which you might agree bares some upside potential in our positively trending modus of operandi. The second attachment is the potential of the items we have bought on Wednesday. Someone suggested Flag day yesterday. As mentioned earlier I repeat it again, Technical Analysis is no glass boll telling you exactly what’s going to happen, no Sir Technical Analysis is all about conditioning.
If one looks at the RSI as a collection of fractals it is also possible to project those into a price chart as I have done before. The third attachment chart you get provides some guidelines as to where you are.
Have fun trading to WIN.
EDIT:
Our Viagra indicator of the shopped items is not doing anything extraordinary today as you can see in the updated chart in attachment four. So it’s about time to have a peep at Yank’s Land as well; similar charts only the Yank’s did push the items trend up in the stretching sense which is a strong signal. However this is also a limited process and timing is going to play a crucial role this afternoon.
EDIT:2
Yank’s Land played its scenario and made us work this afternoon so now it’s up to them to play the rest as well. For the ones of you who play the GJN scenario do not (yet, sorry could not help myself) panic however if you can’t stand the heat, well basically you just have to catch up with your reading so you will be able to pinpoint the details.
Have a nice weekend and cheers.
Attachments
Last edited:
The Dutch Clown
Established member
- Messages
- 592
- Likes
- 11
Week 32.
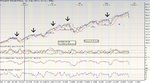
It has been frequently mentioned in this thread and I can not emphasize enough that the phrase “expect the unexpected” should be part of your Trading plan or at least definitely included in the Analysis. The ultimate example has been displayed in the GJN picture which by itself is still valid however in my humble opinion needs some additional analysis work, with all due respect. It is in fact out of respect I share some of my additional analysis work here realizing that it’s impossible to cover each and every individuals taken route.
In general I have to repeat that without understanding the merits of any view it is impossible to know where the critical levels can be found in order to take the appropriate action to, for instance protect your trading position or ultimately exit it. The absolute number one reason I endeavor so firmly to study the different Technical Analysis techniques combine the results with both Trading rules and Money Management.
Given the GJN view one can identify a number of relevant price levels and in order to keep things clear I cover the Monday close levels, which are 517,52 ; 514,14 ; 513,86 ; 507.30 and 493,36. The 513,86 is within the GJN analysis the most relevant level and please notice that from a traders perspective this is a though nut given the level the GJN Long signal was published. The additional motivation given has to do with the retracement levels derived from the previous move which imho should be 469,85-563,98 (mind you there are some alternatives found performing an Elliott Wave Analysis); 38,2% 528,02 50% 516,91 61,8% 505,81. One thing that needs to be included although its old school is the Positive Divergence which might be considered a level of confirmation, a close on Monday above 514,14 (and, well you know) will show an other “potent” Positive Divergence. From a Technical Analysis point of view I understand the conclusion from a Traders point of view there is far too much negotiating margin and since I make money trading not analyzing I had to do something about the analysis part.
As mentioned it’s not my intention to criticize GJN in any way if any criticism is due it concerns the people who rudely comment publications without even haven any clue themselves.
The Elliott Wave Analysis comes up with the above price target levels as well so I will focus on the present movement down starting at 563,98. It should not surprise you that like any decent analysis the Elliott Wave Analysis provides a number of options so I cover only the mainstream which are divided into two camps, a) completed wave 563,98-519,04 and b) the non completed wave. The first category also includes options with a corrective wave down below the 519,04. In order to cover all the options, something like killing all the birds with a single stone, this weeks analysis should start at the 534,04 pivot see attachment. At this stage the best scoring scenario is impulsive so that would fit within the b) category having either a fifth or third wave.
The last Wednesday drop met the bounce back descending support area which is still in function as long as the area by itself has not been taken out. This is a matter of time and/or price and also guides the correction within boundaries since the AEX continues to move within the longer term expanding trending area’s. Having said this you might understand that only at the bottom of those long term expanding trending area’s we will have to consider something beyond the correction level. In general I feel we are seeing a controlled correction blown up by the media putting labels on it since there is no other way for them to explain what’s happening on the markets. For a trader/investor these are golden opportunities to earn a bundle since volatility is huge, so stay focused and pay attention in order for you to get your fair share of it.
The question about the worksheet 2007 projection is an extremely intriguing one since the year’s high just missed by one day and if I just look forward a bit there are actually sticking similarities found crossing techniques. An other thing, this coming week (32) the projection has an essential piece of the puzzle in its chart, so I am curious what the AEX is actually going to put in.
Have fun trading to WIN.
Attachments
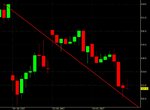
The Dutch Clown said:In order to cover all the options, something like killing all the birds with a single stone, this weeks analysis should start at the 534,04 pivot see attachment. At this stage the best scoring scenario is impulsive so that would fit within the b) category having either a fifth or third wave.
Dear Clown, (just looked at your projection 2007 .. quite fenomenal!)
Sorry for the confusion, but do you mean the best scoring scenario for the 534,04 start-pivot is impulsive and that, within the attached chart, we're either in 3rd or 5th wave?
Im asking since in that case, 5th would be impossible since the preceding fourth wave cant enter the territory of the first wave; if impulsive.
And 3rd would yet be unconfirmed and need a much more extended current alleged 3rd wave down to be in accordance with the rules.
Or..\
Do you mean that the best scoring scenario is the 3rd or 5th wave of a larger degree than the attached chart?
Just started some Elliot (Frost and Prechter) of my own 🙂
Great to see enthousiasm for averages and relativity was farspread before I was ever born.
---
Also, to add a little something of my own:
My current artwork points at a shortterm retracement up very soon. The last time we had a correction-retracement-extension (truncated) there was a very clear and obvious W-shape formed.
This time however, I entertain the possibility of time catching up with us before that happens.
The last few corrections have had retracements up to or near the MA 20, whereafter dropping again. The last correction left ample room up for the retracement.This correction however, is accompanied by a far higher ADX.
The reason I mention the ADX is because its an indicator of trend-strength. It measures the 'strenght' mainly by looking at those components of price actually influencing direction (relative to the day before). basically, it takes all the AEX values outside the values encompassed the day before as a basis for the strenght calculation.
That means ADX is strongly linked to averages and gives meaningfull information about the direction-coefficient of MA's. A high ADX value in a downtrend means the MA (xx) will move down faster than in the case of a low ADX value.
To cut things short, and much simpler said:
I am seriously considering the possibillity of a very much more limited retracement up than last time. A crude an simple extrapolation limits it to 540.
As clown already commented: interesting times! 🙂
P.S. Obvious beyond doubt, my expertise yet has no level compared to for example Clown and Pacito. So please don't make the mistake of attributing any value to this other than your own expertise grants it.
Cheers,
Daan