Clown's 2007 outlook is work in progress

hobby said:
Hobby here! I always read your posts, but never know if you're saying we're heading up or heading down.....in fact, I might as well be reading the calibration guide for the Hubble space telescope.

That is what makes the difference. Trading != have to equal forecasting. That is also where hobby and job seperate..
 
Last edited:
mooi weer maar niet voor hobby-figuren

Since the last mentioned support area fell through a quick update. The AEX has found support at the Dynamic Range Rule trend change level which is 518,39 (13-14u) and the AEX closed below this value in the given timeframe so the GJN taught trending mode changes from positive into negative. The next observation is the Derivative Oscillator has found peer support and turned up thereafter so the AEX is in sync with the DJIA. The third observation is the 526,81 Gann Fan the 2x1 line is functional after the 3x1 line guided the AEX before. This morning the AEX entered the intraday bear range and has to establish confirmation by remaining within the range which upper boundary 14-15u is 519,98.

Mind you the EOD chart bares some challenging clues for later.

Have fun.

EDIT:
A close above 519,33 will mean the AEX leaves the intraday Bear Range or at least changes the trending phase when moving back into the range.
 

Attachments

  • aaa.jpg
    aaa.jpg
    255.1 KB · Views: 232
Last edited:
Dear Clown,

You're right about the hobby thing. Have to see it more as my work.
The oscillator you mentioned was very low (-15,5) today. Page 58 is on the table. In smaller time-frames we have a few NR. Also the hourly begin to run up.

@ Pacito,

Nice view on the picture.

Succes.....
 
and this ?

DDC,

Like the pos rev in this one, target is quit higher.

Curious about your comments

KvKd
 

Attachments

  • stoxx hour 03.gif
    stoxx hour 03.gif
    31.8 KB · Views: 193
Vrijdag 13 april

The AEX is positive trending when using the Dynamic Range Rule RSI and positioned within the Bull Range. In the Bull Range the AEX is positively trending as well and to give you an idea this trend changes when the close is below 512,04 moving into the next Range. And don’t forget to pick up your present.

The intraday chart has just managed to stay within the bear range trending negatively however our Yank friends entered a new phase in their charts so we will probably get a new playing field anyway. So rather spend my time here and now I just might do an update throughout the day when a number of things have changed.

Have fun.

@ Blinker,
Bare in mind that Brown specifically mentioned that the crossing of Fibonacci and Gann have astonishing results. In order to be able to have crossings anyway there should be some form of flexibility in calculating the relevant levels. So here you have it.

@ Pacito,
The relevance of this area has been crystal clear for some time now and the resistance bit when moving up was something not to be missed. Now we see the opposite and the festivity of the Technical Analysis Recognition is complete when resistances becomes support. By the way shouldn’t your Aussie software do the Brown crossing for you?!


EDIT:
Hendrik Jan de Tuinman was sitting in the sun and enjoying the beautiful things nature offers this time of the year when suddenly he realized he had not yet heard his alarm at all, so better check of the thing works anyway. In the intraday chart the 516,05 up (yellow line) trend dominates the 526,81 down (white line) trend so we are on track even the clouds formed by the negative reversal signaling has been blown away by the wind although it must be noted that a slight possibility remains that the present will not be handed over in a straight line. Speaking of the thing, just wondering how many of you did in fact unwrap their present.

@Pacito,
Looked at the Aussies site some time ago and found that the more challenging bits are not included and what I have seen from you so far is that the software is not flexible enough to really get to details and the corresponding complexity.
 

Attachments

  • aaa.jpg
    aaa.jpg
    121.5 KB · Views: 216
  • aaa.jpg
    aaa.jpg
    263 KB · Views: 200
Last edited:
cross

There is a cross today at 517,71. The 2:1 line from dec 1st, the 61,8% 503-526,81 and the green line in the 144 square. All to one point.
Pacito
 

Attachments

  • aextrendchange.jpg
    aextrendchange.jpg
    382 KB · Views: 173
'T is vandaag wat heïg

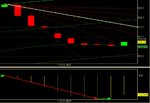
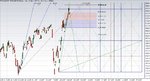
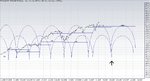
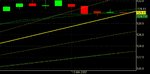
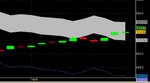
As Clown would say "today, the derivative did its thing again." We have seen the 0,618 of the last decline already. Together with the shortterm trend we could brake it today. The 503 trend you see as the blue line.
The red one direct above at 521,** is the trend from the 5th of march.

So shortterm is up, first target is 526.40 in the fti.

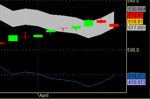
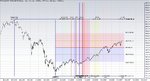
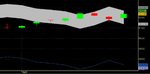
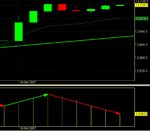
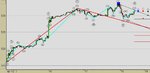
Second picture is the (left) daily- and (right) weekly oscillator. The daily is still down, could pick up some strength. But if the weekly turns down......

@ Clown,

First of all I want to thank you for you're compliment 2 weeks ago on the other forum. I needed that.

Second, I'm not sure what you ment by 'the present'. Is it the PR or the crossing of the der. osc? Or maybe something else? Thank you for sharing.

Success to all of you....

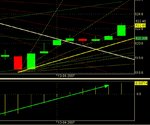
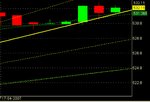
Edit: remember the fibo nivo's... 523,70 Today's close at 523,68
 

Attachments

  • der osc dag en week.gif
    der osc dag en week.gif
    8.7 KB · Views: 144
  • FTI der osc.gif
    FTI der osc.gif
    22.4 KB · Views: 158
Last edited:
ezelsbruggetje: PResent

different PR's on different timeframes can be found, the recent beauty (in fact beauties) has a 536 target, and even a bigger one if you look further back in time in the hourly chart, Charming because it finds a recent confirmattion with lower target ( ca 527) in the daily with a short timespan. The 568 target in the 30'' chart is likely beyond validity.
Cheers.
 
Time, time, time is on my side

Dear friends,
the trend is up. TA is clear, the mood is excellent. One part of the world is taking over the other part. However, the possession of the toy is the end of the joy. Unless there are some irregularities in the books of ABN, the mood can stay good. Two thumbnails as a base of thinking.
Have a nice weekend,
Pacito
 

Attachments

  • aextime.jpg
    aextime.jpg
    333.2 KB · Views: 181
  • 1.2.jpg
    1.2.jpg
    356.5 KB · Views: 178
RSI question

Fellow traders, I have a question about calculating RSI.

I've been working on some software that finds PR's/NR's ect.. now this works fine but the RSI I calculate differs from my broker software.

I calculate RSI with the following formula: RSIt = [Ut/(Ut+Dt)]*100 where Ut&Dt are up&down average over the period.

I've looked this formula up on many websites and always come to the same.. but yet it differs from my trading software.

For example I get the following values on AEX Daily RSI14(Close):
Broker software (Amibroker) - Me
26-1-2007: 51.08 - 59.45
29-1-2007: 51.81 - 56.45
30-1-2007: 55.36 - 65.40

I feel Amibroker is wrong for sure since the RSI does not move to 50 when there's no price change.

Can anyone tell me who or what is wrong? And give me a proper RSI value for one of those dates so I can reverse engineer it perhaps.

Thanks in advance.
 
Last edited:
Stokkie said:
Fellow traders, I have a question about calculating RSI.

I've been working on some software that finds PR's/NR's ect.. now this works fine but the RSI I calculate differs from my broker software.

I calculate RSI with the following formula: RSIt = [Ut/(Ut+Dt)]*100 where Ut&Dt are up&down average over the period.

I've looked this formula up on many websites and always come to the same.. but yet it differs from my trading software.

For example I get the following values on AEX Daily RSI14(Close):
Broker software (Amibroker) - Me
26-1-2007: 51.08 - 59.45
29-1-2007: 51.81 - 56.45
30-1-2007: 55.36 - 65.40

I feel Amibroker is wrong for sure since the RSI does not move to 50 when there's no price change.

Can anyone tell me who or what is wrong? And give me a proper RSI value for one of those dates so I can reverse engineer it perhaps.

Thanks in advance.


Hi Stokkie,

It all depends on how you calculate the Ut and Dt. In the classical way it is the ups and the downs over the period (say 14 days) of the RSI. If you like you can divide it by the period length, but that doesn't change the outcome. The way AMIbroker calculates the RSI uses a sort of exponential average. So in effect the length of the period is extended. The difference between the two methods is like a simple moving average and an exponential moving average.

Now the big question is "what calculation must you use with PR's and NR's". I think everybody uses the exponential calculation these days to find them, but I am not sure.

Below is the code for ProRealTime for the RSI, which give the same results as AMI broker.

IF barindex < 20 THEN
CupExp = 0
CdwnExp = 0
RSIexp = 0
ELSE

factor = (period - 1) / period
diffClose = close - close[1]

CupExp = factor * CupExp[1] + MAX(0, diffClose)
CdwnExp = factor * CdwnExp[1] - MIN(0, diffClose)

IF CdwnExp = 0 THEN
RSIexp = 100
ELSE
RSIexp = 100 - 100 / (1 + CupExp / CdwnExp)
ENDIF

ENDIF

Hope this helps.
 
Rsi

First my real values:
26-01-2007 RSI 51,0841
29-01-2007 RSI 51,8135
30-01-2007 ESI 55,3561
The period is always 14.
Always use the closevalue of the period, not the highs, lows, or anything else.
Then, the RSI as posted (also GJ) is an exponential one.
Last, the formula is used in different ways. The difference is in the days up and days down. Some use 14 days as fixed, while others use the real amount of updays and downdays.
Hope you can find the hoax in your program.
Pacito
 
Thanks for the answers!

I see none are really wrong, just calculated in different ways.

I have 4 years of tickdata on serveral indices so the next step will be backtesting to see which is most effective.

Thanks again
 
Week 16.

Doubt is something that makes me look even more careful at my charts and double check the definitions and calculations. Trading is accompanied by strict stop-win definitions and when not crystal clear I wrap up my positions and take the next one the day after. So when I read the findings of the one analyst I still read I am puzzled since I cannot imagine that he is missing the clear signaling. Than I reverse the thing and scan the facts used to backup the outlook and check my historical charts to see what happened in similar situations. One of my adopted habits it to take nothing for granted so I identified a number of the weak spots within the GJN taught trending methodology and furthermore implemented solutions to overcome those. To conclude according the K.I.S.S. philosophy, the actual performed trades were P ones again so I better stick to my route.

The 61,8% retracement level how ever you want to use it has played it’s role as target and resistance so now the next function is support and this is in fact what we have witnessed last week. The relevance of the 61,8% level is such that it is playing its role for months now and we probably have not seen the last of it yet. How ever you might use the trend in the mean time, there has been an other multiple year high in the AEX last week and it also looks like an other higher bottom.

The Elliott Wave Analysis scenery remains positive with six out of six positive wave levels with the first target range in the 530-536 which is in sync with our shopping list that is in use for a number of weeks and obtains frequently some changes. Thanks for the contribution Quick the best signals are the ones you discover yourself in the charts. Until proven otherwise I will use the 516,05 pivot for my intraday trading as the third wave in the wave starting at the 503 pivot. Yes I agree the AEX looks extremely bearish to me too and I did not even cover the ones in Yanks Land.

The most important clue for next direction you will find in the weekly chart where the make or brake situation is the best fitting description of the actual situation. The daily chart will provide the answer probably on Monday or Tuesday so collecting the pieces of your trading puzzle should not be that tough. The two attachments are the weekly and daily charts with projected RSI applicable sub-ranges.

Have fun trading to win.
 

Attachments

  • aaa1.jpg
    aaa1.jpg
    129.9 KB · Views: 238
  • aaa.jpg
    aaa.jpg
    157.2 KB · Views: 248
De kop is er weer af en het was mooi weer ook nog...

Yet an other multi year high in the AEX however far more relevant is our shopping list as we are working through it item by item. Something to do with the Trend is your Friend and in an up trend the support is the relevant level to watch, so well what can I say. Mind you even though the week started with a blast, it’s the Friday close that will finally enter in the chart since the favorite indicator uses that value for it’s definite figure. The EOD chart has entered a new range which you will find in the attachment however it’s the intraday chart that’s going to tell us how to move forward from here. Meaning if we are going to the next target on our shopping list or if we are having an additional swing for it.

Finally when our last target has been hit the chart should be studied carefully to find an entry for short potential from range to range as we our doing the New School Technical Analysis here. The distinct difference between the P and what formally was known as L trades. The festivity of Technical Analysis Recognition is active in it’s full glory once again so make sure you enjoy it for what it’s worth.

Have Fun trading.


EDIT: (10 graden lager maar daarmee geen slecht weer).
Attached the intraday chart and since a picture says more than a thousand words I better leave it there. The green line beneath the candles is the trend change current range so yes Sir it is still positive within this range.

EDIT2:
Next attachment is the chart from Yank’s Land so you will know how they are over there.

EDIT3:
Just to give you the update intraday chart so you need not wonder how what when. The green line beneath the candles remains the dynamic trend change current range and continues to be positive the trend change 16-17u the AEX < 531,02.
 

Attachments

  • aaa.jpg
    aaa.jpg
    129.7 KB · Views: 261
  • aaa.jpg
    aaa.jpg
    196.5 KB · Views: 202
  • aaa.jpg
    aaa.jpg
    170 KB · Views: 208
  • aaa.jpg
    aaa.jpg
    174.9 KB · Views: 174
Last edited:
Een feest der .......

Well, a trend is a trend until....

We ended today - imh opinion - at a shortterm crossover. In all the intra-day charts there is ND. The der. osc. is also at a cross. Today's high was exactly at a 1.618 extension. I will leave you a picture. Need I say more?

Is here on T2W a Elliot wave expert? I am curious about the best fit counting, especially the daily.

Hope to hear from you.

Success........
 

Attachments

  • FTI der osc.gif
    FTI der osc.gif
    32.4 KB · Views: 204
Woensdag 18 april

How many of you found and utilized the present in the intraday chart of Tuesday not only the plain signal itself but the implicit signaling as well. Yes I know it has cryptic written all over it, I suppose it’s my middle name, bottom-line is that you will have to be sharp like a knife for this game. As you can conclude from the attachments the trend is still your friend and even tough it was tested seriously the dynamic range trend remains positive, the change point of this trend is extremely tight.

Have fun trading to Win.


EDIT1:
As I have told Blinker some time ago I did skip the Elliott chapter in the Brown book simply because I have read other specific Elliott books and use and work with Elliott Analysis software for a number of year’s. The question directs in a way which is so NOT Elliott so I did not respond and since I do not consider myself an expert I felt it was not my call. The remark Rentenier makes (yes Sir I know your source is Brown) that the third wave is never the shortest is in fact incorrect. The impulse waves have different patterns and the one that pops up the most is in fact the Extension3C and yes here the third wave is the largest. However Extension1C and extension5C are also existing patterns and you must have understand that these have first and fifth wave as the largest wave straight from the horse his mouth in case you are wondering. Like other techniques Elliott Analysis has it’s pro’s and con’s.

The AEX fell trough the stop-win and entered the range below which has it’s lower boundary on AEX = 529, 61 (10-11u) which will guide you in case of the next one. Looking at your intraday chart you should be aware of the one thing Brown considers you should learn from the book. It’s becoming something like a broken record to remind you that in a positively trending chart the support levels are the relevant levels. Having played the record once again I should point out that within a trend a contra move is always a distinct possibility. Mind you from a trading perspective you are looking for a nice entry in the bull’s-eye and stick a stop-win to it. Here time comes into the picture!!

EDIT2:
The AEX fell trough the range boundary however did not really enter the next range but produced more or less a reaction back into the left range. Playing with the previous level which now has an AEX value of 529,95 (13-14u) the next range should now be considered more from a time perspective. Basically the inter range trend has changed from positive into negative and we should look at the trend change in the range which is due at 533,89 (13-14u). This will probably make things a bit to complicated so: Since Elliott entered the room I pick it up from my week 16 starting point and well a picture is more than a thousand words. As Brown likes the crossing of both Elliott and Gann best I return to my pre-Brown used techniques. Funny because I initially started to read Brown since it was referenced by GJN for reversal signaling, the revelation on the first page of chapter 9 made me feel right at home. By the way chapter 10 on Elliott is the largest chapter in pages and I cannot find your interpretation Blinker where you isolate the timeframes but maybe I am scanning the chapter with a bit more Elliott like scope.
 

Attachments

  • aaa.jpg
    aaa.jpg
    124.9 KB · Views: 230
  • aaa.jpg
    aaa.jpg
    181.8 KB · Views: 213
Last edited:
Blinker said:
Well, a trend is a trend until....

We ended today - imh opinion - at a shortterm crossover. In all the intra-day charts there is ND. The der. osc. is also at a cross. Today's high was exactly at a 1.618 extension. I will leave you a picture. Need I say more?

Is here on T2W a Elliot wave expert? I am curious about the best fit counting, especially the daily.

Hope to hear from you.

Success........

I am not an EW expert and I don't have EW software, but it looks to me we have an impulse wave up from 473. Looking at the chart we currently have a 5th (sub)wave. Now Connie says: "The third can not be the shortest". If this all is correct, the impulse wave up should stop around 536/537.
 
Top