Clown's 2007 outlook is work in progress

Stjekelig onderwerp

Nice post. I consider the RSI in bearterritory if it went under 40 and stays under 60-65. I consider the RSI in bullterritory if it has been above 65 and stays above 40-45. I know Clown has a more sophisticated way of looking at these things with the dynamic RSI, but at the moment I have not enough time to pay more attention to the RSI. Volume is indeed an interesting subject. Its a shame that Euronext doesn't give the volume of the AEX directly. It seems to me that you can do your calculations from the FTI as well as from the AEX itself. I do the same you do in looking at the longer term first and then at the shorter term. A change in trend however can be found first in the shorter term and eventually in the longer term. The timeframes I use most depends on the trading. I use monthly and weekly charts for shares, and days and hourly's for entrypoints or exitpoints. I use hourly's, 15 minutes and 1 minutecharts for options. Not that I don't look at the tics but most of the times that's to fast for me to buy or sell. I use Elliot in all timeframes because I can reckognize the waves very quickly. I pay more attention to the Elliot waves in the daily and longer frames because there are more possibilities and it takes longer to figure out where we are. That's just because the feedback takes longer. I use Gann only in the daily and longer timeframes. I'm trying to trade direction-independent as far as possible. But the chances of profit are much bigger when trading on the upside in an uptrend or trading on the downside in a downtrend, then trying to trade every upswing in a downtrend or every downswing in an uptrend. I also use other indicators as the Cardwell, the MACD and the Stochastics. I'm not looking for the holy grail in an indicator for I don't believe it exists.
And last but not least the proof that europeans are more optimistic than americans. The european indexes reached their retracements at 50% and the americans only at a lousy 38,2%.
Pacito
 

Attachments

  • aex.jpg
    aex.jpg
    325.2 KB · Views: 180
  • cac40.jpg
    cac40.jpg
    235.8 KB · Views: 152
  • dax.jpg
    dax.jpg
    292.6 KB · Views: 178
  • dow.jpg
    dow.jpg
    253.4 KB · Views: 156
  • ispx.jpg
    ispx.jpg
    259.7 KB · Views: 165
prana

for clown especially and everyone else who can read Dutch is prana an interesting magazine which appears six times a year for only 6,50 in the better (bigger) bookstore. or 28,50 for the whole year.
the current item treads Fibonacci and the universal freqenci. and much more.
however it is not ment for direct financial investing.
 
Week 11 including some food for thought.

The overall AEX outlook has changed last week from an Elliott point of view looking at it from the helicopter. A number of weeks ago I explained how I use the different wave pattern alternatives found and the combined outcome shows doubt again after last weeks trading. Not a signal to immediately wrap up all your long positions and turn them into shorts more a signal to be alert since the up and down patterns have similar characteristics which effectively means that they signal neutral (+ and – is neutral) in a long term up trending market. Using a technique like Elliot patterns is not something you pick up easily and an analyst screaming extreme index targets around using Elliott as his credentials can not be taken seriously. However it seems to me that people rather follow such a tribe paying the Chief and lose money trading than spend time and brain to think.

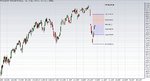
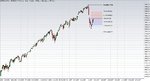
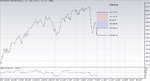
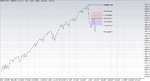
Last weeks findings are still valid and the preferred wave 2 has now found it’s place at 469,85 same observation the inter wave time relationship is way off. The 38,2% retracement level has been met and the next is the 50% level at 461,01 also spread over the net so let’s include the 61,8% level as well at 448,87 so the “feest der herkenning” is complete. If you are interested just let me know and I will generate idiot-proof analysis for each and every extreme index value you come up with, what?, do I hear AEX 100 over there, and the 70 guy woke up as well, I did not hear anybody shouting 1000 yet. The guy who first mentioned Elliott to me does his analysis and his conclusion is: 1) the AEX has come to the 50% retracement level and that’s our signal to look for short positions at 469 targeting 410 stop-loss 512 ; 2) the AEX retraced more than 50% and is looking to find it’s way back up so Long at 512 and stop loss 469. I did not read any analysis/conclusions from him for weeks I just know where he is coming from so I copied his line of thinking, DO NOT USE THIS FOR TRADING. Please gentle people do not get ahead of yourselves here.

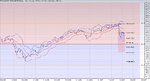
Now let’s focus a bit more on the two pivots 512,47 and 469,85 to move in the direction of next weeks road map for the trades to win. Mind you the result you get from any Elliott pattern analysis is static and at the end of the day a completely different pattern might pop-up as the one. You can do two things: 1) join the SOB-club that rejects everything since it does not work 2) you can think for a minute and use the goodie’s and isolate the weaknesses. The present 512,47 pattern with the best score referenced towards the Elliott definitions is called DoubleZigZagC with the first wave W on 469,85 and the second wave X on 492,02 so the third Y is now heading down and has target levels 460,40 and 451,10 providing this is the pattern that’s the final one. Not so fast.

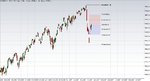
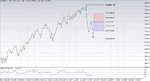
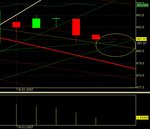
Before you place your bets first get your act together and let’s look at the 469,85 pivot for a minute. This is very good example where the Elliott static character exposes itself in full glory by throwing a number of pattern options at you that if you simply look at them are completely out of order. Don’t worry be happy the 469,85 upswing can be monitored with a number of other techniques as you can read in the daily posts. From an overall picture in this swing the retracement levels are indications to work with and the two relevant right now are 50% at 491,16 and 61,8% at 496,19. At the 38,2% level last week we have found turning potential used it and were thrown out again by the excellent working trading rules. Currently at the 50% level the position is short and the guards are in place.

This week I took a few words more to put Elliott in perspective since I pick up Stjekel signals that the used timeframes are unclear. Elliot Analysis uses wave labels in different degrees which are linked to time but not as strict as you are used to by using week, day, hour, etc. The moment I started using Elliot I started using time in a totally different perspective and that might be a bit confusion, I use typically six (yes 6) wave degrees in order for you to find your way I refer to the actual pivots in price and to keep this readable I do mot repeat the obvious ones (however you can find them in the earlier posts). When I started using Gann, time became an even more important piece of my analysis and trading. And now it has become such an important piece I am studying specific area’s to learn more about the time aspect since I am convinced that time is an ignored factor. The third factor is volume and I did not even cover that in a way I feel comfortable with although my appetite completely vanishes when I read that someone when the trading volume increases concludes the market intends to move up (die klap is geen daalder waard). I might be completely wrong here but my understanding has always been that volume shows the number of actual trade transactions meaning entity A buys and entity B sells. So I smiled when the self exposed prime flock member did ask if anybody could help him find AEX volume data. Trust you get the picture!!!

As I explained in my introduction (Thread Donderdag 13 juli 2006 post nr 17) at the T2W forum I make an explicit difference between the two mainstream Technical Analysis tools and techniques: the lagging ones and the reading ones. While 99% of what you are being offered is about lagging indicators and techniques I focus primarily on the reading side and even some of the lagging bits and pieces can be used in a specific setting as reading. And no Sir there is no such thing like “The Holy Grail” and I am not looking for it either. It has been my conviction that crossing indicators and techniques should be able to supply a more than excellent road map for the trades to win, the Brown book was the first acknowledgement from a different source. It’s not a complete set of instructions you can set up and collect your trades to win, it’s more an invite and stimulation to a undertake an discovery journey. Hard work.

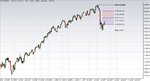
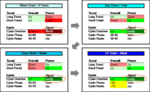
Let me in more accordance with the traditionally used timeframes shortly recap the KVKD trending area systems I have developed and use for guidance and reflection. The daily version left the 409,56 system on February 28th and I am currently scaling a new one depending on the actual figures it will be a 512,47 down one or 469,85 up one. The weekly 307,31 version survived the recent index drop and in fact turned it this week so this coming week will be exciting. The monthly 217,80 one has two versions which both allow further index drop. In this respect especially for Pacito; this is where we figure out how the anticipated serious 2007 drop looks like when this drop is the one versus the autumn possibility.

The introduction of Nol1 I applaud extremely since I have been experimenting all sorts of exotic option flavors some time ago even guided by so called experts. Basically this route failed in my case due to the lack of vision the underlying value movement. If I read between the Nol1 lines – sorry bad habit I know – the potential has been diminished by the computerization of the financial community and the use of hard and software by individuals on a large scale (guilty as charged). This doesn’t mean I am not triggered by the brainteaser question: “did you make the up most money wise out of your vision by using the best possible instruments”. Without going into too much detail at this point in time I use strict rules to monitor and qualify my trading in the sense of target index points performance. The two main instruments I use are index futures which bring EURO 200,- per index point and sold index option positions bring half plus some extra when volatility is up a bit. For investments I use the major price swings in the individual chart as reference to buy and/or sell the pieces accompanied when appropriate by sold option pieces. Due to infrastructural challenges – read software suppliers do not deliver what they claim and data suppliers delivering way below acceptable quality - my investments system is not yet fully up to speed and level I want it to be. As long as it’s making money it will have to do for now since I am spending too much time working lately as it is.

Hence I have come to my two page limit.

Have fun trading this week.


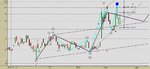
March 9th found Candles
High wave
Spinning top White
Spinning top neutral
 
Van voor naar achter van links naar rechts...

A quick update from my side after having worked on some of my indicators and many backtests crashing my software over the last few days :-( I made some changes to my indicators after all of these tests and doing some more reading and studying.

Day chart
Yesterday the 494.5 level indicated during the weekend actually did serve as resistance and as of that moment the FTI turned downward even dropping theough the 491.25 level which was a resistance at the end of the day. During the day the FTI also fell through its recent uptrendline (since 5/3) and closing lower forming a dark cloud cover as was already indicated by Clown.
RSI stalled and the momentum is now lost in the upmove.
Next few days will be key. I expect a downward move, but am not convinced yet whether the RSI can go into oversold territory again like it did two weeks ago. This might be interesting for any possible resulting divergence and its interpretations.

Yesterday
In the morning the FTI quickly moved into overbought territory when reaching 494.5. From there it was down. Importnat to see was that the FTI fell out of its uptrendline, and through the 491.25 level which served as resistance at the end of the day.

Trading system
I am still working on my (still quite traditional I guess) approach but backtests on a system for intraday trading purposes have shown extremely promising results (but ok, results from the past...). I will try and stick to the approach for today. It makes entry and exit decisions based upon a combination of indicators for trend and momentum and combined conditions.

Have a good day you all,

Stjekel
 
Just back from a little break. At the moment (almost) no position and no opinion regarding the option market. For the short short term option traders. Mind you this friday due to extended daylight savings time in the US, the university of michigan will report within expration. Lets wait and see if option-pricing is accordingly.
 
So much for backtesting ;-)

Day Chart

After these last two days, the FTI has become a little bit less healthy so to say. Yesterday it broke through the 50% retracement level but bumped of the 494.5 resistance in an overbought situation before reaching the 61.8% level at 496.9. Subsequently it fell through the low of 10/01 and started its downturn with also touching upon the 23.6% retracement level of the recent upswing at 488.8.
The RSI stalled at the middle zone of its chart confirming the turning around of momentum.

Today this downward move was confirmed as expected. It found resistance already below the 491.25 level of 10/1 and then turned mostly southward during the day to finish and confirm the dark cloud cover of yesterday. Disturbingly it thereby fell through the 38.2% retracement level of 485.2 and even closed below this level at the end of the day. This gives the FTI room to further go downward to the 50% level at 482.3, 61.8% @ 479.4 and toward 470 again (and beyond).

As said this morning, it will be interesting to see whether a lower bottom will form at a higher RSI which dropped somewhat today. For now, the scenario still looks somewhat like the May 2006 scenario as indicated earlier by Pacito with a similar pattern, also in the RSI. Then a lower low was formed with a higher RSI then followed by the long uptrend until November.

Today's feedback

My backtested system was a disaster today... I'll be honest ;-) so it was quickly back to interpreting the chart together with the signals which gave better results during the day. The backtest done and optimized over the last few days gave 100% winning trades combining RSI (for momentum), Stochastic (for cycles) and the DMI (for trend) with combined conditions, but as said... past results are no guarantee for the future... That's clear today!

I am still maintaining some of these ideas in my trading, but reading these signals WITH the chart in several timeframes is key. This week has been better than last week as I have 69% winning trades up to now, so better trade signals and follow up.

Overall not a bad day although most of the profits were wiped away as I was stopped out in the last 20' and I didn't see an early exit sign after we crawled temporarily out of the snake pit... So my exit signals are still to be improved in order to change a majority of profitable trades also into a real substantial profit...

TBC

Good luck tomorrow,

Stjekel
 
Last edited:
en alweer een mooie nieuwe dag

Stjekel,

Don’t emphasize too much on back testing since it is only an indication nothing more and remember what each and every financial offer includes as a disclaimer: past performance is no indication whatsoever for future performance. Brown specifically advises you to take the indicators and techniques you use apart in order to fully understand them and more importantly their behavior in specific situations. The thing that works for me is to put things on line and work with the stuff notice what it effectively does in what situation think about it and change things a bit so they become more like you need to in order to improve your trading performance.

Even more important are the trading rules you use and trade by, they will have to be simple and straight like a K.I.S.S. thing if it’s to complex you would be able to apply them. Everything you use from the Technical Analysis department is serving your trading and not the other way around.

Let’s pick up our week 11 road map and conclude that the AEX has closed below the 469,85 KVKD trending area system and in Yank’s-Land we have seen a bit of a drop since than. So even though a bit premature I scaled several options to create a 494,40 KVKD trending area system to find my way through this trading day.

Have fun trading to win.
 
Surfin' surfin'.....

Clown,

Thanks. I am already on that road. I have some time this period so I am slowly but surely growing into something that fits my trading attitude.

My suppositions are as follows:
- There is almost always a trend (trend = a difference between the value of two subsequent bars) even though your capability of seeing it depends upon your timeframe. Short term trends show up as waves on the waves of other timeframes (Cycle Theory of Hurst). You have to correctly "pick the sea you want to ride".
- You have to correctly "ride the waves", i.e., using momentum type of indicators that indicate highs and lows of the waves. You have to correctly "size/smooth" the momentum indicator to catch the wave you want to ride (i.e., enough amplitude for trading at the for me relevant timeframe).
- You have to catch the "high quality waves", using trending indicators (are we going up or down the wave and how fast?) and the RSI (how deep/high is the wave?)
- You have to at least be aware when you are riding against the big wave (trend at the longer time frame) and prefer to ride the waves in the direction of the big waves.

Based upon that I was already working, but now I have programmes some simple and "home-made" indicators that appear on the same screen (so less need to switch from time frame to time frame) to help me in finding the right waves.

Let's surf again!

Stjekel
 
Good surfweer vandaag op het wad!

Well, I must admit my approach that I developed over the last few days really paid out today! I was honest yesterday, so I can be honest today as well. 8 out of 9 positive trades today, and that on a choppy sea. Let's see if this approach can stand the test of time!

Although we mostly discuss option stratgies, concrete vision for the next days and weeks here, I would appreciate also the TA discussion sometimes lacking on other fora ;-)

What did I change/do over the last few days?

First, doing short term daytrading, the time value of options was really in my way. And not being an expert in the field of option constructions (which also take time to evaluate and to put into my system), I decided to focus only on the FTI and to start trading only futures. KISS, right?

Second, as explained in my earlier post today, I am focusing on catching the big and small waves with my surfboard, based upon the Supposition Principle in Hurst's Cycle Theory.
So identifying the small waves, checking if they are in sync with the big waves and the existing trends at the short and long time frame, and then evaluating the potential with the momentum.

- For identifying the small and big waves I use two Stochastics, optimized for my time frames (short term and medium term waves).
- For determining trend I have "programmed" a very simple version of the MACD, that shows the direction and speed of the underlying trends at different time frames (short, medium and long term)
- For evaluating the potential (or quality, risk) of the trade I evaluate the RSI at the different time frames, together with the degree of synchronisation in the different time frames

I use the above for both entry and exit signals, together with sometimes resistance/support and fibonacci levels in the price chart.

Maybe not as sophisticated as your system Clown, but at least today it has shown good results. Even when I myself sometimes thought: "Mmmm, will this really be a good wave to ride Surfin' Stjekel?" And in almost all cases it was!

Hope all of you had a good day as well.

Surfin' Stjekel
 
Up and down and up and............

Don't be too proud on winning today. There are seldom such days when almost every move is a winning one. Even if your mind was not set to see AEX down, you could make a profit. If you sold or bought at 476 then you just had to wait until you made a profit, then repeat the same thing and it worked again. With such a volatility and a really sideways move except for the last half hour you didn't have to be clairvoyant. I hope your system and indicators will prove their value, but today was not a real test. The AEX touched or crossed the 476 17(!) times during the day.
Pacito

2 Spot on.
 

Attachments

  • aexb.JPG
    aexb.JPG
    23.8 KB · Views: 185
  • 1.jpg
    1.jpg
    337.1 KB · Views: 173
Last edited:
Gewoon doorgaan

Stjekel,

It’s good to hear you had a excellent day well what can I say, I had a blast today even when at some point in the afternoon I met somebody who put up over 400 fti’s in the bid at 495,90…. I have to admit it scared the hell out of me… I just noticed a trend change and the brake down of a resistance level. Looking at the charts the downside potential is there however it’s questionable if we are going to collect it tomorrow so I closed all trade positions in the auction.

It has been some time since I have read something written by mister Hurst and my recap simply was that the challenge was and still is to generate the dominant cycle. Elliott provides waves as well and I use typically six levels on each and every relevant pivot. For trading the starting point has to be a scalp set up, than monitor it by both scalp and short term criteria and move it along with corresponding definitions. The KVKD trending area systems are a crossing of a number of techniques and it provides me with trend including direction, entry’s within the trend and exit points where trend changes are due which by than are entry’s. The most important feature however is that it completely is K.I.S.S. and that additional techniques can be used on top of it.

Today’s activity results in, if you look at the chart an island and it will be extremely interesting to see what tomorrow will bring to the table. No matter what, the existing signals are still valid and I will follow those when appropriate, there are going to get some turbo guy’s completely lost again. Between trading and other stuff I have been exploring the Astro Finance a bit and it stroke me that this week was popping up in the Clowndicator chart as a downer. Together with some other signals it really was amazing and the appealing thing is that the forecast can be made well in advance and when combined with the other stuff it should bring the icing on the cake. So this brings me back to your mister Hurst, where he primarily is looking at the sinus wave shape the universe is more into ellipse shapes just play with the differences for a while and it will come to you I am sure.

Although the message from Pacito could be considered a bit untactful his message is straight forward and completely correct.

Have fun trading to win.
 
Een zwaluw op het wad...

maakt nog geen zomer...

I know, I know... I have experience.

But the way my approach worked today was independent of where and when what waves would have been placed. The fact that it crosses so many times only made me make many trades, but the principles were solid I found out, which gives me confidence. I'll keep you posted on the results and my learnings (if interested).

I have found an interesting document on the web which covers some ideas that I coincidentally developed myself as well (to find mutiple summed cycles by using multiple stochastics).

http://www.biz-analyst.com/library/stocks_commodities_trend.pdf

Thanks and good luck tomorrow again,

Surfin' Stjekel
 
Roller Coaster

It takes quite some time to trade in these circumstances. The reason I rather trade in a somewhat longer timeframe, no matter how profitable the short trades can be. Tomorrow I shall try to trade keeping in mind an expiration of 480 or 485. For next week I still see a continuation of the dowtrend which should end at about 460, the last not necesarily next week.
The european indexes al showed a lower low and, until now, a lower high. All the indicators are negative . So I put up some bearspreads for april already.
Good trading,
Pacito
 

Attachments

  • aex.JPG
    aex.JPG
    160.7 KB · Views: 167
  • aex.jpg
    aex.jpg
    261.9 KB · Views: 167
  • cac40.jpg
    cac40.jpg
    265.4 KB · Views: 165
  • dax.jpg
    dax.jpg
    280.3 KB · Views: 155
Pacito said:
It takes quite some time to trade in these circumstances. The reason I rather trade in a somewhat longer timeframe, no matter how profitable the short trades can be. Tomorrow I shall try to trade keeping in mind an expiration of 480 or 485. For next week I still see a continuation of the dowtrend which should end at about 460, the last not necesarily next week.
The european indexes al showed a lower low and, until now, a lower high. All the indicators are negative . So I put up some bearspreads for april already.
Good trading,
Pacito


Dear Pacito.

Y have seen yesterday on the AEX een higher LOW off 473.
Did y see it wrong?

With respect.
 
Golf op golf op golf

You are right, it does take preparation, analysis and time during the day. But as I am "in between jobs" I have the time to invest now (as well as that I can use the money to not fill the current gap with savings...).

Today was a good day again, but again got a nasty surprise at the end. My 1' and 5' charts didn't immediately reveal the last upswing, but when later checking the waves in longer time frames I should have known. So again a part of my profits wiped away at the end :-( But in terms of profitable trades I am still confident in (and sometimes stunned by) the approach: 6 out of 8 P!

Let me try and give a view on the FTI from the Cycle perspective. First time I try this based upon good results from my day-trading (and my learning at the end of the day).

For every time frame I look at "overall trend" and "current power/direction" (at that respective time frame). Next to that I try to capture the cycles: their "direction", "phase" and "room to move" (mainly based upon stochastics and RSI indicators). See the attached summary/overview which serves as background to my trading during the day.
The 5' and 1' cycles drive my trading decisions, but this overview helps me being aware of when I am trading against bigger waves (like at the end of today) and to stay on the right side of the market (when 5', 15', hour cycles are indicating long, I will prefer longs in surfing the waves in the 1' chart and know that shorting could pose a risk).

Have fun riding your waves again tomorrow,

Stjekel
 

Attachments

  • FTI.png
    FTI.png
    21.5 KB · Views: 198
we zijn weer los....... en.... aktie

That’s what I have guessed the CycleFinder well I have one of those based on Hurst mathematics myself as well but I seem not to have found much use for it yet. I might be able to help you since I have the projected peaks and troughs (P/T) according to the cyclefinder as well.

Timeframe Base Cycle Length next P/T in bars
1 min 115 P in 5
5 min 75 T in 34
15min 63 T in 18
1 hr 85 T in 6
1 day 103 T in 44
1 week 47 T in 15
1 month* 57 T in 11

*Due to the fact that my AEX data file only starts at January 1985 I could only correlate the monthly cycles over 3 base cycles all the others were correlated over 5 complete cycles (chips I now realize I could have included the + and – correlation as well). If you like I can however do the same exercise over my DJIA data file which starts in 1897.

For the people who do not understand the first thing about cycle analysis please note that even though the findings show a peak or through coming up it does not necessarily mean the price moves up or down. The principle is based on a perfect sinus wave but the two characters driving this form are time and amplitude, in cycle analysis the focus is more on time rather than the amplitude (read price). And a practical note is that the checking of the cycles especially in the smaller timeframes takes quite some computer power that I do not use it online.

To use the Hurst cycle as the Dominant cycle to feed the Stochastics as my guess is you do is something that I have tried but it did not strike me so I rather would use something like the Ehler dominant cycle since it comes closer to the eyeballing results. I haven’t gotten into the Fourier analysis yet there is only 24 hours in a day you know.
Have fun trading to win.
 
Week 12.

The weekly overview might be somewhat a copy of last week however the overall Elliott Wave Analysis picture has become a bit more negative and the anticipated wrap up of the second wave (see previous weeks) can now be found in the overall analysis as the two wave count labels that have the shortest timeframe changed from neutral into negative with the appropriate targets.

The main argument from the Elliott Wave Analysis point of view has been and still is the factor time and if we use the now best scoring scenario and roll that out into the future using the ideal relationships the wave 2 is due second half of May. And yes the world is not ideal and neither is the stock market so let’s not even dream about it, an analysis could be at least consistently, I will be the first to agree that this analysis technique isn’t perfect. Given the fact that Elliott is all about patterns and the market did forget to form actually some bits of those by the gap openings last week one has to be extra careful concluding.

The Technical Analysis New School provides us with some clues to move forward as indicated already last week at the “wad”. The Friday expiration did produce some more or less unexpected moves and I understand that people got lost. By the end of the day the level playing field did not change one bit so we are going to prepare for the next relevant moves. The KVKD trending area has been slightly adjusted due to the Friday intraday movement and is more in sync with the actual VIX chart which brings us two options for the road map. If you have a look at the VIX chart you will find Negative Divergence indicating a declining volatility however I did an Elliott Analysis on the VIX and the attachment is self explaining.

The Finance Astro Cycle study provided the second attachment which shows the more robust bear cyclic influence. Mind you it struck me that I probably was too much focused finding the exact moments in time that can be linked to specific market characteristics. As there is no such thing like “The Holy Grail” I might as well stick to the crossing of different techniques so if you look at the chart the timeslots where to look for short possibilities are highlighted. The toolkit I am using intraday provides more details about the exact routing in the fine-tuning sense. Back testing in my book means that this aid should have indicated the more relevant bear opportunities in my data file and in such a way that it’s workable something like an alert phase.

The thing about Cycle Analysis is that it just can’t be used as an isolated tool for trading. Study showed that in the financial markets only about 15% to 30% of all price motion is oscillatory and therefore useful for trading. This is why the general consensus is that markets are 80% trading and only 20% trending so in accordance you will find numerous pieces of analysts conclusions who present you trading ranges. This is the improvement area where you are going to find the trends within the consensus trading ranges.

If you have a look at your charts you will find in the combination of old and new school Technical Analysis a sort of trading range as well and due to the nature of the utilized tools it’s even a dynamic version. On top of that the new school brings you the reading bit whereas the old school is primarily lagging.

Have fun trading to win.
 

Attachments

  • aaa.jpg
    aaa.jpg
    228.3 KB · Views: 210
  • aaa1.jpg
    aaa1.jpg
    241.7 KB · Views: 212
Looking at the price-indicators I am working with all trends are pointing down. You can see in the first picture all lines and dots are red. Also the hi-lo indicator is above the AEX-index and the resistance was not broken in the last up swing. Of course RSI and momentum in the lower part of the picture are also negative.

The second picture shows the 15-min chart. I think we just exited the upswing (green pitchfork) on the downside (the AEX closed lower than indicated in the picture). If the AEX is heading down, then the red pitchfork might be the channel to look for. Note that the upper line of the red pitchfork is the resistance line 512-494-486.
 

Attachments

  • aex20070316.gif
    aex20070316.gif
    23 KB · Views: 150
  • aex20070316min15.gif
    aex20070316min15.gif
    21.3 KB · Views: 142
Top