The Dutch Clown
Established member
- Messages
- 592
- Likes
- 11
Maandag 5 maart
Without any announcement GJN his daily column today has been written by someone else and please do read the disclaimer at the bottom so you know how to read/use the column.
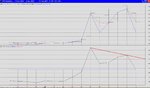
Attached the intraday chart for today and trending signals. The hourly signals will change some more due to the gap opening this morning.
10-11u rrt = - rrr = 476,50 rrtc > 479,97 ; zo eerst nog maar eens een lekker bakkie
11-12u rrt = - rrr = 474,97 rrtc > 478,25
12-13u rrt = - rrr = 474,69 rrtc > 477,74
Let’s include the downside potential generated by the Positive Divergence note that this is the extreme and the more relevant one is formed by the projected: extreme 452,57 projected 468,59.
13-14u rrt = - rrr = 474,51 rrtc > 477,34 pde = 452,13 pdp = 467,71
Take a moment and think Elliott pattern like described in the weekly outlook wave 4.
14-15u rrt = - rrr = 474,22 rrtc = 476,88 pde = 453,54 pdp = 468,54
15-16u rrt = - rrr = 474,17 rrtc = 476,65 pde = 449,25 pdp = 466,77
Update chart and also notice the derivative Oscillator.
16-17u rrt = - rrr = 474,12 rrtc = 476,47 pde = 448,81 pdp = 466,84
17-Clo rrt = - rrr = 473,46 rrtc = 476,39 pde = 447,21 pdp = 466,48
PS.
Cassandra,
How I think about JS you can read in post 47.
Without any announcement GJN his daily column today has been written by someone else and please do read the disclaimer at the bottom so you know how to read/use the column.
Attached the intraday chart for today and trending signals. The hourly signals will change some more due to the gap opening this morning.
10-11u rrt = - rrr = 476,50 rrtc > 479,97 ; zo eerst nog maar eens een lekker bakkie
11-12u rrt = - rrr = 474,97 rrtc > 478,25
12-13u rrt = - rrr = 474,69 rrtc > 477,74
Let’s include the downside potential generated by the Positive Divergence note that this is the extreme and the more relevant one is formed by the projected: extreme 452,57 projected 468,59.
13-14u rrt = - rrr = 474,51 rrtc > 477,34 pde = 452,13 pdp = 467,71
Take a moment and think Elliott pattern like described in the weekly outlook wave 4.
14-15u rrt = - rrr = 474,22 rrtc = 476,88 pde = 453,54 pdp = 468,54
15-16u rrt = - rrr = 474,17 rrtc = 476,65 pde = 449,25 pdp = 466,77
Update chart and also notice the derivative Oscillator.
16-17u rrt = - rrr = 474,12 rrtc = 476,47 pde = 448,81 pdp = 466,84
17-Clo rrt = - rrr = 473,46 rrtc = 476,39 pde = 447,21 pdp = 466,48
PS.
Cassandra,
How I think about JS you can read in post 47.
Attachments


Last edited: