FTSE 100 intraday trading - JUNE 2003

Bonsai.
Can you kindly tell me what settings, should I have on my MACD.
Do you have the same setting for all time periods.EG.from one day to say ten days.
My settings are set by sharescope on 13 and 26 periods with signal properties of 9 periods.

Hope you enjoyed your fishing trip,we missed you baby.
 
Bonsai

Thank you for the info re EW. I will have to add this to the list of holiday reading, just ordered Piper's book and Trading the Zone by Mark Douglas.

Re my comments on the 15m chart; I have had a change of heart and intend to trade from a 2m chart for both my IB and D4F trades. This way I can concentrate on one chart but applying different strategies. I can get 6.5 hours on my screen using the 2m chart so I can continue to use this for my small point deals with IB and trade the main trends using D4F at the point where the trend changes. Normally I would use a 15m chart but by decreasing the spacing on my 1 to 3m charts I can now have enough of the day covered to ensure these trends are highlighted.

By using the smaller time frame I get an earlier position especially if I am applying the trendline of the SMA rather than the price. I am currently using a 15" monitor but intend to move over to a flat screen and may then be able to apply the 1m chart for the whole day without the price bars becoming to compressed. By setting the chart in this fashion means I must employ the whole screen which means I have to forsake lower indicators on this chart for the time being. Probably will have another chart on the tool bar for appropriate times but essentially will only trade the intraday trends and not reversals unless good divergence on 5m chart. To begin with will just work from the 2m to test it's reliability and can expand the deals in the future. The idea behind this decision is to make my chart and my strategy as simple to apply as possible so for now I am going to remove my lower indicators and make better use of the good old trend line and my usual SMA pivots.

Kevin
 
Fluke
lol
May/June is the best trout fishing before the sea trout come on.

On the macd settings on my main trading system I only use 1hr/1day. Don't bother with a signal line but watch the price action when it starts to bottom or gets overbought/sold.
I employ a colour change when it changes direction.

For my 10 day chart I use an RSI based on a 3hr average.
It tops and bottoms very nicely.
The time interval on both is the same at 2 mins.

My hourly charts cover about 9 months and are used mainly
for trend lines/ fib levels etc.

btw, I also have a 25 day chart to cover the option periods.


hope it helps
 
kevin
sounds like your software is a limiting factor ?
I am lucky in that respect because I build my own charts and
size them as I want.

On my chart screen (17") I have 5 different charts
2 min (covers 3 days)
macd ( ditto )
10 day
25 day
2 day dot. (for picking off gaps)

a PAGE DOWN gives me
10 day with RSI
25 day with daily candles

another PAGE DOWN gives me the same for DAX then S&P etc.

Pipers book may now be sold out. Let me know if you have difficulties getting it.
 
The day chart didnt show the full wave count so
I have posted it here AS I SEE IT. so beware. There are always
alternative counts available and that makes it impractical to
use elliott as a trading system.
 

Attachments

  • flat.gif
    flat.gif
    6.2 KB · Views: 284
Bonsai

It is for this reason that EW does not play a major part in my trading I am aware of it and should it appear in the correct set-up then fine but all to often it does not appear in the sequence described.

I prefer to follow a simple trendline strategy with a little help from SMA and EMA. It is always best to trade in line with the trend as there tends to be more upside. The trend line provides an area of support and after a break resistence at the next move in the new trend. May not be to everyone's liking but it is a relatively safe approach. The more difficult part is when to take your profit. I only daytrade so I use a target range unless things clearly change before the target is reached.

It sounds like you have set yourself up with a very professional package, for me all I really need is sufficient data to cover the changing trends so 4 to 5 hours covers it. All that is then required is to identify the changing trends during the day. I can get all the data on the screen for a 1 min chart but it would be to compressed however a 17" or 19" screen will resolve this problem.

Re Piper's book I have been given a delivery date of mid July so about a month. Online purchases advise you to contact the publishers direct for availability and ordering so I went into WH Smith's may cost a little more but I had to go into town so I thought I might as well kill 2 birds with 1 stone.

I noticed your info on another thread regarding posting charts. I was going to post one of my own and followed your instructions only to find the dimensions of my chart are to large (1024 x 768). Would you have any idea how I could reduce this to meet the requirements of this site.

On holiday next week so will catch up on my return and update re Piper's book.

Regards Kevin
 
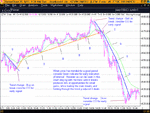
Another attempt with the chart. This displays 2 trading strategies from 1 chart. Good luck to all on holiday now.

Kevin
 

Attachments

  • ftse 13 june 03 - 2m e & sma.gif
    ftse 13 june 03 - 2m e & sma.gif
    174.5 KB · Views: 256
aha
I see you managed to overcome the problem. But you are
not the only one to have had problems so I have started a
thread which deals with posting a chart and in particular
provides a utility which will allow you to reduce its size.

So if you have anymore problems, suggest you take a look.

nice chart !
 
Bonsai.
Thanks for your reply about your macd.However,I want to get my settings as near to your's as possible.My sharescope macd asks for two period settings and the default is 13 and 26.what should I set these numbers to,in order to get near to your one hour/one day setting.
 
Fluke
I dont see the problem.
you have 13/26 !
but what are the units of time ?
just adjust them ?
if you cant tell, suggest you phone sharescope tech support.
 
Its opened at 4126,there's a lot of resistance above, I'd expect it to fall today.
 
I am still convinced that this market can only go up in the medium term. My demented logic is :

Bush must win next election and will do what must be done to win - so US markets up and we will follow.

So, it lots of up with reluctance.
 
morning
I see Man U have got in trouble with FSA for not making statement to Stock Exchange about Beckham.
 
I don't know which way it's going, I just took that short for my own interest, I'd have made more money trading intraday. I've been looking at the DOW the last couple of days.
 
It seems they want him out. I hope he makes his mind up soon, the normal Beckham background coverage is enough for me!
 
havent seen any signal to close shorts yet
but its starting to just sit there and look at me again.
as if .....
 
Top