You are using an out of date browser. It may not display this or other websites correctly.
You should upgrade or use an alternative browser.
You should upgrade or use an alternative browser.
somebody was asking about my charts ?
this is what my 2 min filter chart looked like at close of business.
nothing very special I dont think
the 2 trend lines are my resistance lines and the dotted line
is the gain line.
any number of systems would have worked today
including just drawing a line across the tops at 9am and 11 am.
this is what my 2 min filter chart looked like at close of business.
nothing very special I dont think
the 2 trend lines are my resistance lines and the dotted line
is the gain line.
any number of systems would have worked today
including just drawing a line across the tops at 9am and 11 am.
Attachments
Bonsai
On the 2 charts posted today (10m and 2 m) what periods are the SMA's (at least that is what I assume they are).
Is that +29 on the day, if so what were your entry signals sorry if you have already covered this in a previous thread.
Kevin
On the 2 charts posted today (10m and 2 m) what periods are the SMA's (at least that is what I assume they are).
Is that +29 on the day, if so what were your entry signals sorry if you have already covered this in a previous thread.
Kevin
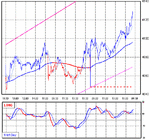
personally , I find the volume on these charts as telling as the charts themselves. Have a look at this.
<img src="http://stockcharts.com/def/servlet/SharpChartv05.ServletDriver?chart=$indu,pltc[pa][da][f!3!!]&pnf=y">
that looks a lot like accumulation to me.
<img src="http://stockcharts.com/def/servlet/SharpChartv05.ServletDriver?chart=$indu,pltc[pa][da][f!3!!]&pnf=y">
that looks a lot like accumulation to me.
Bonsai,
That's my point. How can you apply a volume to something that has no time frame. Your up column of Xs might last any amount of time, for instance, 4 days 3 hours 10 mins, it can continue to go up and down in the same column before reversing to 0s. How can you apply the volume? 😕
Cheers
That's my point. How can you apply a volume to something that has no time frame. Your up column of Xs might last any amount of time, for instance, 4 days 3 hours 10 mins, it can continue to go up and down in the same column before reversing to 0s. How can you apply the volume? 😕
Cheers
Similar threads
- Replies
- 866
- Views
- 118K
- Replies
- 478
- Views
- 74K
- Replies
- 197
- Views
- 35K