You are using an out of date browser. It may not display this or other websites correctly.
You should upgrade or use an alternative browser.
You should upgrade or use an alternative browser.
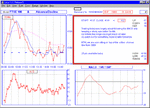
bonsai said:somebody asked me about gaps earlier on.
this is the dot chart I work from and it covers the last 2 days.
It is a 2 min chart and shows up the gaps quite nicely.
.
You can't be serious bonsai.....................this is utter nonsense.
hi bonsai/boy
sorry press the wrong button before trying the message.
fete short term chart from june i am getting the indication we are about to turn down? stochatics over 80 turning down
cci 140ish turning down only indicator macd not yet turned down
from 12/3 i counted wave1 and wave4 down from18/6 and we are in wave5from thw low 3964 .
and 38%wave3(594)+3964 4189 we have turned down.
does it make any sense??
are we about to test the lows?
thank you
Hi bonsai
I am a learner still . so my wave counts should be taken with a pinch(buckets )of salt. well as i look at it
wave 1 up 3287- 3861
wave 2 dn 3861-3613
wave3 up 3613-4207(4219 intraday)
wave4 dn 4207-3954
wave 5 my tagets 4189/4261/4338/4558
but because we have extended wave 3 wave 5 could truncate/fail
i am still vary of reaching 4558 because this level could the ultimate target of this run.
appreciate your input.
sumathik
ok , see where your'e coming from.
and you could be right but
3 waves are usually strong and the climb was I think,
very measured , slow , and was slowly losing momentum ?
also I am uncomfortable with the 1/2 count.
it just doesnt feel right.
Unfortunately I dont think my own wave count is clear cut either.
You need to look at an hourly chart but I have your 3861
as the end of 3 and the fall to 3613 as 4.
Which makes the whole of the subsequent move the 5th
and is still in progress.
And when that 5th finishes , it will be an A wave with B and C still to come.
Anybody else want to join the hazards ?
Good Morning Gentlemen,
Well I'm still dowm £300.00 on the month
but I feel I'm learning, slowly, thanks to you guys. I actually made a few points (8) this morning on that break down(Avalanch?) at 08:52 from 4130 to 4120 on the FT Future.
1)Have learn't the importance of cutting losses very quickly(I'ts took me nearly five years messing with options to learn this!).
Not a very quick learner am I? LOL.
2)Not to try and guess an entry( because I can't afford many misstakes)
3) Gradually learning to wait for mrkt to signal me, and not the other way round.......this I find the hardest thing!
Anyway Lads, Thanks, keep up the good work.
Ian(taxi)
hi done it again sorry
1up 3777-4185
2dn4185-3287
3up 3287-3861
4dn3861-3613
5up3613-?
if we have subwaves of wave5
again1up3613-4011(15/5)
2dn 4011-3980 (not happy with this count )
3up 3988-4207(18/6)
4dn 4207-3964
5up 3964-?
I am doing it from end of the day data feed so you will have better counts from hourly charts.
still i am looking for pull back soon
then abc??
Hi Sumathik, interesting counts.
One point, in that last count of yours you have
1up 3777-4185
2dn4185-3287
But your wave 2 cant go past (3287) the begining of wave 1 (3777) ... that's one of Elliot wave rules.
The only way of counting 3777 as the low would be as an expanded flat correction.
I'm going to try and post a chart of my 2 pence worth, but bit busy at the moment.
Similar threads
- Replies
- 478
- Views
- 75K
- Replies
- 808
- Views
- 107K
- Replies
- 197
- Views
- 35K