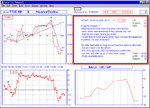
FTSE 100 intraday trading - JULY 2003

Anyone know a way to trade this £$%^.?

I can't decide if it's bullish or bearish. It's broken the upward trend line, but any decline gets bought? Last stand or ready for a rocket?
 
hi hungry bear
not sure how to advise because I dont know about your
trading methods.
but the macd on page 1 will keep you relatively harmless,
I would have thought, if you are normally trading macd
and familiar with its quirks.

But at this moment in time, the trading trend is down and
I have not seen any action to make me think a reversal has started.


edit
I would also keep an eye on the morning call for S&P
which is on the same page.
- not the most bullish picture ? -
 
Thanks bonsai,

For longer timeframes I use Delta, 1 hour stochastics and for confirmation, lower high & low. Bollinger Bands are also helpful, but only when they're flat. Intraday I have a simple system I developed using 2min bars and a 30MA, backed up by stochastics on the 2min & a 5min chart.

It does seem that the trend has turned - from your post I deduce that you had a confirmation of the change before I did. MacD isn't an indicator I've used, so I'll have a look at your reference to see if it can improve my trades! :D
 
it's looking like a really messy morning. -5 for me. i've had enough! good luck to everyone else!
 
has broken the line across yesterdays highs.
looking for a retest and then we will see ?
 
hmm
+/- 10pts from the open after over 4 hrs does not
make for happy campers.
But cant you feel the bollies tightening ?
meanwhile macd struggling to go anywhere.Stuck at zero.
But the long side has been the trade for a while.
 
my meter read 4125
anybody else get that ?

Do you suppose there were a lot of stops there ?
 
boy
thanks

butnow instead of trading at a discount to cash
it is about the same !

btw, that cost me -10.

b i t c h
lol
 
just done something I don't usually do.
stayed long through the close.

but out now at 54 for +17

b i t c h
still, got my money back and a bit more.
 
One of those geometrical days people write books about ?
All sorts of diagonals at work and with fib value gradients.

The top line down from 184 signalled the rise for the day and
the trend line from 045 under this mornings low told us when it
was all over.

The market then fell until it met up with the top line from 184
and proceeded to bounce. (made my day).And continued to
recover after the close.
 

Attachments

  • jul29.gif
    jul29.gif
    23.1 KB · Views: 233
Top