You are using an out of date browser. It may not display this or other websites correctly.
You should upgrade or use an alternative browser.
You should upgrade or use an alternative browser.
own charting package - v.interesting! do tell us abt it one of these days/now (?) AND also if/when u have inclination to do so.
how long did it take to write? who provides data feed? which language? which indicators have u programmed (tho this u may not answer i suppose)
is it for sale?
perhaps u want someone to try and test it for u? 🙂 u have a volunteer here mate
cheers
how long did it take to write? who provides data feed? which language? which indicators have u programmed (tho this u may not answer i suppose)
is it for sale?
perhaps u want someone to try and test it for u? 🙂 u have a volunteer here mate
cheers
Bonsai,
Ok seen them this is something I do not have access to although I have got Fib retracements on Sierra but it produces about 5 lines and clutters the screen so I don't bother and work it out myself. In the past because I was trading the small points system I did not really have time for it but now I will pay more attention to it. Although I still keep an open mind!
I do not really want to step up my charting facilities until I can make best use of them when full time, I am happy to take the middle ground which I feel Sierra real time provides.
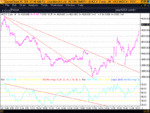
Here's another view of today its interesting how the trendlines remain reliable on the long term (I mean for the chart length) while the same lines on the RSI only work for the first trend after that you have to apply the shorter trend on the RSI for second break above line. The RSI is not so reliable in this fashion although nice failure swings.
What a difference my chart makes this one has been decreased 6 times to expand it for nearly the complete day, makes for a more vivid picture.
Attachments
dsmodi
in brief
I have a data feed with dde links
1)
I use a spreadsheet for my realtime activities which
only involves reading the dde data for a variety of indices both
cash and futures and looping at whatever frequency I choose.
Incorporates audible alarms and responds to voice commands.
2)
I use VB applications for hourly, daily and weekly data.
data stored in random file data base.
Allows for a variety of portfolios and detects ma xovers, trend line
breaks and rsi extremes.
Do my own testing, but thanks for the offer.
It's not a one-off project.
Been continually refined over the years.
Used to be written in DOS basic many years ago when I had
an IBM pc with 16k memory.
😆 Enough for anyone ? 😆
Last edited:
Bonsai,
Thought you might have called it a night before 1am LOL.
If ever you need an additional tester or you consider marketing it I would be interested, it sounds intriguing.
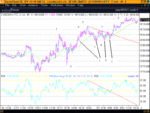
To continue from yesterday the EW pattern looks very different on the FTSE chart (although my chart missed the first 25 mins)
Would you see it as I have marked it down. Today's rise as the 5th wave, with the turn back after hours and early action as a 3 wave abc correction. (I will add the index chart on next post and that looks to be just continuing yesterdays C or 3.
I have also added 1 - 3.
Position 1 shows the price to have a slight pull back while rising yesterday and again by the futures close to around 3999.
Position 2 is the first pull back this morning and from this chart we are in a clear rising trend from the previous day so only considering buys at the start. The RSI has also plotted a higher low while the price is at the same level at position 1. From my system this would be a buy probably with a price a few points above 4000 if you allow for confirmation with the price moving bak up. What I would be interested in from your own set-up would you also have seen this as a buy and would you have put your stop at 3999 or lower at 3990 (I am working from the price bars and not the SMA).
Position 3 is a clear buy signal and if I had any doubts at entering at position 2 I would be diving in here, it is also backed up by the RSI. This time the price is a little higher, so the close stop at 3999 looks another possibility.
Obviously the later trendline cut confirms the early entry and new wave from this chart.
Just trying to see if I have understood your method of placing stop points. In the past I just blindly set the stop at 4 points because of the scalping rather than at some identified price position from the chart.
Kevin
Attachments
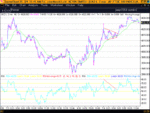
Cash chart - not so different after all wedge or flag pattern notice how the RSI does not produce a failure swing early this am as it did on the futures chart; but a simple continuation signal either way it was up from this point and another confirmed buy.
Kevin
Kevin
Attachments
kevin
I dont think this is going to work
-I find your charts difficult to read. I dont use bar charts. And you
seem to have a 2min average in pale blue which is making it
worse.
-I closed my trade at the close last night. The point about that
is I was waiting for a signal this morning. I would not go long
so close to obvious resistance at 30.
now we have a retest and fail, I notice the sell off is quite muted.
but neverthe less short at 26
It may yet retest 30 again but it could be all over because the
high today is higher than the high yesterday which could signal
the end of 'C' of abc from low at 3981 and big '4'. So we may now
be in 5th wave down starting from 4100.
also my rsi is overbought. Cant comment on yours, do not
use standard rsi.
Think you may have to work out your own wave count.
Bonsai
Thanks for trying and adding your own assessment from your charts. When you are applying EW do you prefer a particular time frame and if so which one.
As for today I am still not trading due to situation here, in and out to much but would have taken 2 positions from the trend today, an early buy as indicated and a sell just below 4020 and at the moment the line chart has been close to passing a rolling stop position from the 5 min chart that I would have set at 4008.
2 deals for me during a morning is much more relaxed than normal with what would have been a nice outcome. Bonsai there does seem to be something to this approach. It may not be the same as your own but it has similarities.
All the best
Kevin
Chow,
I know how it feels if thats any help!
The trend was down at the time and on my chart (futures) 4008 had proved to be an earlier resistence to any lunch time rise. As soon as this level was not breached and the price turned down I would have closed and sold. However I would not have gone against the trend when you did as I prefer to look for a failure swing (divergence) when the price has daylight. I mean the position at about 2.54pm where there had been a nice continuous down trend from the cluttered period where you took your entry. I find these signals are clearer and often associated with a price turned break as well to help you with your decision.
The period you got in unfortunately had seen a nice drop earlier but had already created a bit of clutter and produced a small range before it failed again.
Hope this helps, it is often better not to go for a reversal but lok for another move in the trend until the signal is as clear as water.IMHO Any deal against the trend during the day must be seen as speculative unless taken with a strong break to this trendline. The 2.50 position was the break of the near term trend (or last fall) back to around 1.38pm although the complete trend from 11am has now been broken with about 7 points on offer so far. It appears to be creating a higher lower pivot so could rise further but needs to break previous high in move of 4000, otherwise down trend from 11am may continue.IMHO
I use an RSI setting of 14 on both 2 and 5 min charts.
Kevin
barjon
Legendary member
- Messages
- 10,752
- Likes
- 1,863
Jonny40
The advance/decline line (cumulative total of winners and losers) does iron out skewing caused by the different weighting. eg: if ten of the highly weighted constituents have a particularly good day then ftse will do well, maybe despite the fact that a high proportion of the remaining constituents are losers. This may cause a divergence between the A/D line (which may fall) and the ftse which has risen.
Any divergence between A/D line and ftse usually resolves itself by the ftse correcting to the direction of the A/D line and it is not a bad indicator in this respect. I read somewhere that trouble looms when the generals lead (ftse making new highs) but the troops refuse to follow (A/D line fails to make new highs).
Good trading
jon
reactor
Member
- Messages
- 82
- Likes
- 1
a bad day for me. -29.5 from three trades. first trade went short way too early in the morning. second trade went long but had caught the movement too late. third and last trade, went short again and should have exited at 3995, but didnt so as a result made another loss as i exited right at the end of the session.
i've attached the execution statement, which is appropriately named. i definitely need to relax and think more about my trades over the weekend!
i've attached the execution statement, which is appropriately named. i definitely need to relax and think more about my trades over the weekend!
Attachments
Similar threads
- Replies
- 478
- Views
- 70K
- Replies
- 808
- Views
- 102K
- Replies
- 197
- Views
- 33K


