You are using an out of date browser. It may not display this or other websites correctly.
You should upgrade or use an alternative browser.
You should upgrade or use an alternative browser.
Just as an after thought does anyone here trade the FTSE from the above 3 chart time frames with separate deals for the different time scales of daily, weekly and monthly charts.
Just find it interesting how theses charts present different views of what I would act on if seen on my intraday chart.
Kevin
Just find it interesting how theses charts present different views of what I would act on if seen on my intraday chart.
Kevin
Wideboy
you could be right but there is a fib at 3959 which may yet
give us pause for breath ?
4219/3800
Hit it today.
Kevin
I trade different time frames.
My hourly chart covers about 12 months. This gives me longer term trades for futures.
Sometimes both short term and long term give the same message
which tends to use up a lot of my margin, so there are limits.
With the failure of the top channel line, I was short Sept futs
as well as intraday trading using Rollover Cash.
But I dont have intermediate time frames; just 2min and 1 hr.
Hands up anyone who couldnt find a decent entry today ?
One of those days you wish you had stayed short over the
weekend ?. (But there are many more Mondays when you were
glad you didnt ?)
I put up a post earlier today of my RSI. Needless to say it is now
deep into oversold territory. (But I have known it to stay that way
for several days). So it may now be out of play. That's the trouble with s/term indicators.
Attachments
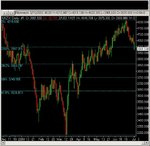
Any thoughts on the apparent testing by the SP500 yesterday. Once the early June low was breached (972.6) a quick fall away to test the 50% retracement of the May 21st -June 18th rally (964). Then a powerful charge back up again. If SP500 to-day is up, then this would mark a successful test (Wyckoff) and signal higher prices. Therefore, bullish for FTSE. As an aside NASDAQ did not take out its recent low
Bonsai
Re RSI it depends what setting you are using and your software but when the RSI is in an early stage of oversold it can continue to provide a signal if it remains within its own trend and or along the way bouncing of the 30 or 50 line.
On an old site I used there was a tendency that once the oversold or overbought levels were reached the indicator would then plot sideways underneath the upper or lower level. This was a strong signal that the trend was remaining. If in doubt take to settings I found the 14 and 21 quite good. 21 acts as a filter for the 14 and just depends over what time frame you use it but it worked very well on a 5 day 15 min chart.
Re your charts - you do appear to get a lot of data on your screen from your charts and still remain quite clear. How much time is displayed on your screen when using the 2 min chart.
I like to see what has happened through the day on my chart and often need to reduce the screen image on my 15" screen t achieve most of the day with anything less than 10 mins. I did like using a 15 min chart covering a 5 day period for assessment but my software with Sierra only cover about 2 and half days unless again I reduce it which I feel reduces the sharpness and quality.
What would be your entry or exit signal from your intraday dealing from your 2 min chart - sorry if this has already been posted.
Re Piper's book - no longer in print tried several different companies however Global Investments put me in touch with 'The Way to Trade' who now provide the book and other services. You can only get it in e-book form for a bit more. It would appear that they have expanded from the book to provide additional services with the likes of newsletters and several different courses by Piper and others in the form of Bronze, Silver and Gold levels and prices to match.
If it had not been for the good recommendations about the book by yourself and others I would not have given this a second glance as it does come across as one of those making more money from selling the COURSE rather than trading it like so many others out there. However having said all that I do not know for a fact so the course etc maybe worth the money, who knows.
It can be found at www.The-Way-To-Trade.com.
Kevin
Bonsai
Just read your earlier post and not sure I understand. Why do you feel there was no opportunity to enter a sell before 1pm yesterday. IMHO there were several periods to sell and hold with the 34 EMA remaining above the price throughout and 2 SMA breaking down a few times.
Kevin
Just read your earlier post and not sure I understand. Why do you feel there was no opportunity to enter a sell before 1pm yesterday. IMHO there were several periods to sell and hold with the 34 EMA remaining above the price throughout and 2 SMA breaking down a few times.
Kevin
Attachments
kevin
what I said was " Picking an entry point was risky "
there was no close and clear stop to work with.
On 2min charts , I can have as much data on screen as I want.
Its just a matter of sizing the chart to the screen size.
But I tend to limit it to 25 days to cover monthly options/futures
to expiry.
PS : I maintain separate 2 min charts for 3 days and 10 days and
25 days. I also have 2 min Dot charts for 2 days
PPS : Remember, I chart the cash and trade the futures.
you seem to be putting up charts on futures.
Last edited:
Bonsai,
Thanks for the clarification. I think I must work from a shorter time frame because if I see a deal with the price under the 34 EMA or 13 SMA on 5 min chart with the 2 period SMA following suit then that is an entry to sell for me; and I place a tight stop of 4 points and try to allow it to run for 2 or 3 SMA sequences or pivots unless I get a very low reading on the 14 RSI with a band reversal looming.
I have been displaying the Futures charts as I trade through IB although I use D4F cash as back up. While the prices are different the price changes appear the same. I moved to the Futures chart as my main source of data because D4F apparently produce the cash price from it.
I use Sierra charts (they are not by any means the best) because for real time data they appear good value for money. However I am unable to view the amount of data you are. My 2 min chart is pre-set to cover just over 3.5 hours, I can decrease the spacing to extend this to cover the complete futures session but it reduces the display the further I go back. After a day it is not worthwhile and I have to go to a longer time frame or scroll back. Obviously I can scroll back over the past data but nothing beats viewing it on the one screen.
Is there some benefit from charting the cash price against that of the Futures?
And what signal would you look for on your 2 min chart or is it the 10 min you make your decision from for a longer hold.
Thank you
Kevin
kevin
10 min ? what 10 min ?
cash v futures.
I think cash gives better signals.
I can switch off at 4.30 knowing I have captured the whole day.
after hours futures without the cash is very artificial, imo
use lots of different signals.
I think I posted about them before.
10 min ? what 10 min ?
cash v futures.
I think cash gives better signals.
I can switch off at 4.30 knowing I have captured the whole day.
after hours futures without the cash is very artificial, imo
use lots of different signals.
I think I posted about them before.
Bonsai
Thank you, I would have to admit that I have limited experience in trading futures past 4.30pm but I have traded several times towards 5pm. Maybe I have been lucky that there were no horrible spikes or wild spreads but I would agree that by 4.30pm you should be done and dusted for the day.
I think I would only keep going now if it was in a strong trend as we approached the close and may hold for 5 or 10 mins depending what happened after the close.
Are you able to elaborate how the cash gives a better signal than that of the Futures. Sorry if I am pestering just trying to learn new tricks and get an edge wherever possible. I take it you also use the cash to trade with D4F.
Re Piper's book have only just started it but I like some of the concepts and the pyramid titles, especially the last one.
Re your entry signals sorry I must have missed it will go back over thread.
Kevin
Similar threads
- Replies
- 478
- Views
- 74K
- Replies
- 808
- Views
- 106K
- Replies
- 197
- Views
- 35K