Clown's 2007 outlook is work in progress

The Dutch Clown said:
EDIT1:
I.... use and work with Elliott Analysis software for a number of year’s. The question directs in a way which is so NOT Elliott so I did not respond and since I do not consider myself an expert I felt it was not my call.

You're right.
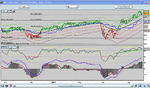
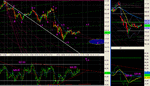
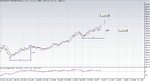
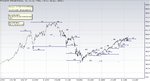
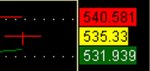
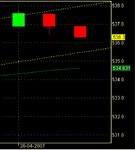
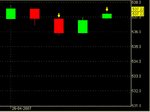
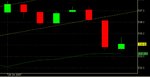
I know you have optimized the Elliott software, I was curious about what it tells you now. The most likely count in the hourly or daily chart....

Some time ago, BElieVE left us some pictures and told us one and other about Elliott. Have not hear from him again.

Good luck
 
veel pr-vogels in de lucht

The Dutch Clown said:
How many of you found and utilized the present in the intraday chart of Tuesday not only the plain signal itself but the implicit signaling as well.

Dear Clown,
I traded on PResent signals in the 15/30/60" charts with timeframe starting 16/4 - 17/4, build up due p58 occurrence; before the end of day the targets were met. There is more in the charts left: 1) starting end last week, and 2) builing up today, with a new entry this morning....approx 9:45, but not too confident whether this one will hold..considering the moves around 11:00 h....we'll see...
cheers.

EDIT: added a chart as illustration. right now the RSI seems to find support on the yellow support line (which in fact was drawn a month ago)...and which also supported a previous PR signal (529,64) as well
 

Attachments

  • aex180407.gif
    aex180407.gif
    39.3 KB · Views: 172
Last edited:
The Dutch Clown said:
.....
The remark Rentenier makes (yes Sir I know your source is Brown) that the third wave is never the shortest is in fact incorrect. The impulse waves have different patterns and the one that pops up the most is in fact the Extension3C and yes here the third wave is the largest. However Extension1C and extension5C are also existing patterns and you must have understand that these have first and fifth wave as the largest wave straight from the horse his mouth in case you are wondering.
...

Dear Clown,

Is the statement of Connie about the 3rd wave is never the shortest really incorrect? My interpretation is that either the first or the fifth of the waves up may have an extension, but the other two should then be around the same size. So looking at the chart I would say that the first is extended (extension 1C) and thus the third and the fifth should be equal in length. Is it possible to have both the first and the fifth extended (so that the 3rd is the shortest)? Anyway if the fifth will not be longer than the third, then the current impulse can not go beyond the 536/537.
 
rentenier said:
Dear Clown,

Is the statement of Connie about the 3rd wave is never the shortest really incorrect? My interpretation is that either the first or the fifth of the waves up may have an extension, but the other two should then be around the same size. So looking at the chart I would say that the first is extended (extension 1C) and thus the third and the fifth should be equal in length. Is it possible to have both the first and the fifth extended (so that the 3rd is the shortest)? Anyway if the fifth will not be longer than the third, then the current impulse can not go beyond the 536/537.
There are however arguments to state that we are in wave 4 at the moment.
From 473-513 I, 513-505 II, 505- ? III
Then subdivision wave III, 505-524 I, 524-518 II, 518-532 III, 532- ? IV
For the last count the 3rd has the steepest slope, that would fit. Wave IV did not cross the top of wave I. These counts suggest a continuing pattern , target 550. I would not trust trades to be funded on elliot alone.
Pacito

PS There's another counting possible. That counts the wave 511-473 as an A, the wave 473 untill now as wave B. The target for C would be the bottom of the preceding 4th wave 417.
 
Last edited:
Donderdag 19 april

This week started taking the 516,05 pivot as reference within the larger picture to do some wave analysis on for trading purposes and in the yesterday’s post you will find the outline which is crossed with other techniques in use. Basically the idea is adopted from the connecting Trending modus of operandi and embedded relevant level so I end up with an extremely workable assistant scenery for trading. The Elliott Analysis informs us to keep an open mind towards a continuation of the sideward down moving wave and since Friday we will have the monthly expiration, just play it on the safe side, remember to expect the not expected as well. Mind you there are alternative wave counts possible and it is not impossible that one of them will prove to be the winner (for instance the one that already places the second wave) however it may turnout to be today’s trades had the P written all over them.

The intraday chart shows the AEX has found it’s way in the Bull range and is within that range negatively trending as I updated you already on Wednesday. To give you an idea the range on Thursday 9-10u is 534,08 < AEX > 530,34. It has become a routine to attach the EOD chart with the active range so you find it once again.

Have fun trading to WIN.


EDIT1:
The intraday Dynamic Range Rule RSI remains trending positively although it’s a close call the threshold 10-11u AEX < 523,93. The AEX has entered the Bear Range and is positively trending within this range where the AEX threshold value 10-11u is 523,17.

@Rentenier U prikt een vorkje van Dre mee.
Took a similar entry with other arguments see edit1. The trade got confirmation rapidly and now finds a series of thresholds that need to be taken down. Moving sideways along the yellow dotted line might do the trick but the divergence potential (lampje?) is building up that entire route.
The intraday Dynamic Range Rule RSI threshold 11-12u AEX < 522,48.

EDIT2:
Well folks the AEX has arrived and it’s time to make up it’s mind. The third attachment is the second projected into it and updated with data.

EDIT3:
Since I let you in on my trading position this morning I consider it’s only fair to inform you that I am wrapping it up when possible at 5 index points plus some tip money for my broker note when possible otherwise they go just close to the 5 points and I smoke one cigar less tonight. Money in the pocket/bank is the best possible money I think anyway.

Cheers.
 

Attachments

  • aaa.jpg
    aaa.jpg
    114.2 KB · Views: 243
  • aaa.jpg
    aaa.jpg
    125.2 KB · Views: 193
  • aaa.jpg
    aaa.jpg
    134.5 KB · Views: 165
Last edited:
Took a long position around 10. A few pictures added.

EDIT: I kept a small long position. EOD was above EOD stoploss and all indicators are green. I hope not to regret it tomorrow.
 

Attachments

  • aex20070419.gif
    aex20070419.gif
    15.6 KB · Views: 152
  • sp20070419.gif
    sp20070419.gif
    12.1 KB · Views: 138
  • euryen20070419.gif
    euryen20070419.gif
    11.9 KB · Views: 151
  • aex20070419II.gif
    aex20070419II.gif
    16 KB · Views: 173
  • aex20070419III.gif
    aex20070419III.gif
    37 KB · Views: 144
Last edited:
Een Elliott telling

Well, let me try to count the waves..
I suspect we ended yesterday with a wave 2 up, we are now heading for a wave 4. Although there is - in the hourly - a new pr, we will go down one's more. My best guess is bottom at 523,55 (nr 523,35) at 17:00 hr.
We'll see.....

Ploatje d'r bij.

Good luck,

Blinker

Edit1:
Ok, I was wrong about the target. Maybe Elliott is not my thing?!
@ Clown, cheers...
 

Attachments

  • een Elliott telling.gif
    een Elliott telling.gif
    66 KB · Views: 176
Last edited:
Blinker said:
Well, let me try to count the waves..
I suspect we ended yesterday with a wave 2 up, we are now heading for a wave 4. Although there is - in the hourly - a new pr, we will go down one's more. My best guess is bottom at 523,55 (nr 523,35) at 17:00 hr.
We'll see.....

Ploatje d'r bij.

Good luck,

Blinker

Edit1:
Ok, I was wrong about the target. Maybe Elliott is not my thing?!
@ Clown, cheers...
Why were you wrong? Try to see your interpretation and match it with what happened. Is there another possibility that you didn't see. That's the only way to learn something. Don't throw it away.
Pacito
 
1 Month of trading with Connie's Customized vibrator

Another week with many hours of work has passed with good results! PR/NR analysis brought out some really trustworthy trade signals and actually working out different calulations of RSI made me understand the working of this very well and also its weaknesses in certain situations..

In the picture you see a month of trading signals with a customized Connie’s vibrator with a custom time frame. This was the result of a few days work after taking the chapter about messing with indicators as much as possible seriously.
This picture is of an xxx min graph but also on smaller timeframes there are very nice possibilities with non-standard time frames.

Off course, not 1 timeframe/setting works for all kinds of markets; it has to be changed according to market conditions with certain variables. In a fast trending market like now this setting really shows itself off!

This, applied with some trending methods and the right garden fences can bring good profits.

GL
 

Attachments

  • Connies vibrator.jpg
    Connies vibrator.jpg
    28.4 KB · Views: 207
Last edited:
Vrijdag 20 april

Today we have the monthly expiration so there might be some disturbance although it should not be exaggerated that’s more something for the fear guru’s and people who haven’t got a clue. My bottom-line is to keep things simple do the nice trades and get out with the money. If we look at the Elliott waves once more the bit from Thursday’s low was more corrective than impulsive so that might be an indication that it belongs to the second wave in the Wednesday picture.

From a trending perspective nothing has changed dramatically since the GJN taught trending methodology for the intraday chart continues to be positive. From a range rule perspective the AEX is in between Bear and Bull range, from the Bear Range point of view the index is trending positively and if we define the area in between also as a range the AEX is trending negatively in that in between range. To give you an idea of that range (9-10u): 526,05 <AEX < 530,04.

In the EOD chart the AEX managed to remain in the projected range and the last day of the week will be influential also for the projected week range we started this week with.

Have fun trading to WIN.


EDIT1:
The intraday mainstream trend is positive and within that trend the AEX has moved into the Bull Range this morning with an other Gap opening. The AEX is now trending negatively within the Bull Range which is at 10-11u: 530,03 <AEX< 534,61. The Elliott inter wave relations have a preference for a corrective rather than impulsive character although it must be noted that the gap openings do not constructively effect an Elliott Wave Analysis. Given the validating presents that were left in two charts yesterday I have a bias to forget the Elliott findings for now. Back to my best friend the Trend.

EDIT2:
In an up trend the support levels are the most relevant ones, the reason why I frequently used the word threshold instead of resistance. The intraday chart reveals the thresholds and the potential support area’s , you are aware of the targets your presents carry, probably you also use some of the other goodies as well so you are well equipped to do some additional trades to WIN. Just add that the AEX is positively trending in the Bull range which 14-15u is: 531,33 <AEX< 535,30.

EDIT3: pats pats pats pats
My shopping list has been completed and especially to Mr. Jvdlow who I directed quite some time ago towards the correct Positive Reversal Signaling with the appropriate targets I say it was once again a BLAST. All my MLT positions are being closed right now or have been closed already you can find my hints history at the known Dutch forum for learning and amusement.

Have an excellent weekend the whether is going to be enjoyable.
Cheers.
 

Attachments

  • aaa.jpg
    aaa.jpg
    157.5 KB · Views: 222
  • aaa.jpg
    aaa.jpg
    235 KB · Views: 184
Last edited:
According to Tom DeMark trendline method the AEX has a price target of 538. See picture for a rough calculation (530,2 + 531,6 - 523,8). Lets see if the AEX can make a new high.

EDIT: long position closed: centerline pitchfork hit
 

Attachments

  • aex20070420.gif
    aex20070420.gif
    20.2 KB · Views: 166
  • aex20070420II.gif
    aex20070420II.gif
    17.6 KB · Views: 152
Last edited:
Toch maar een nieuwe...

Pacito and Clown, thanks for your reply.
Were did I go wrong? Ok, it was a corrective wave. Not a 1-5 but an A-B-C.
So I changed the counting and have found a new one.

We are still in a trend. Wave 3 ended a few minutes ago. So we are now heading for an A wave in the fourth wave? I'm not sure because we are still in the trend and also have new PR's. We'll see...

Success
Oh ja, uiteraard zegt een plaatje meer dan woorden........

Edit1:
First picture shows us today's results. It was a very strong day. All the PR's have been met. The 5th wave was a blow off, just like the book subscribes.

Second one (is the 3th) shows you the correction after triple witching hour. So this is the result in the May future. The correction isn't over. I think Monday we slightly open lower. My best guess is that this is the A correction in the hourly chart. B will go up again to go to a lower C.
Mark the 1.618 extension! Even in the smaller time-frames it shows.

Have a nice weekend. I know I will......
 

Attachments

  • een Elliott telling.gif
    een Elliott telling.gif
    47.4 KB · Views: 184
  • een Elliott telling.gif
    een Elliott telling.gif
    51.5 KB · Views: 167
  • Nieuwe Elliott telling mei.gif
    Nieuwe Elliott telling mei.gif
    23.5 KB · Views: 184
Last edited:
Time for weekend

What a lovely trading day today! But now, it's time for weekend.

I included today's tools (Trending, PR, Connie’s vibrator in the back of my mind) and E/E.

Edit1:
And what do I do in the weekends? Well, after a bit of enjoyment it's time to analyze the previous weeks market movements.

I attached some more pics:
-Connie’s vibrator I mentioned. Yesterday I posted the picture already but did not mark the obvious high probability signal shown in the graph yesterday. Watch the last movement in the graph.
-The PR. I'll give you something here; consider a PR target to be only met for 80% and you'll be better off predicting price targets.
-In the PR picture; also the Major trend (green) that has been the most important since 504 (this has changed today) and showing what happened after my exit.

What do I do with an exit? I make my trailing stop-loss very tight on my trade to maximize profits on ‘market errors’. I don’t do this during the predicted movement because the market might error out of my margin and destroy my trade.
The red lines are obtained from the Gann wheel. If you haven’t yet, you should try start and play with this thing since it can give you some very important variables (targets) to consider in your projections.
Crossing trendlines are very important! Does nothing occur on the crossing; consider your trend wrong.

GL ;)
 

Attachments

  • Clipboard01.jpg
    Clipboard01.jpg
    43.8 KB · Views: 152
  • PR.jpg
    PR.jpg
    157.6 KB · Views: 170
  • Connies vibrator.jpg
    Connies vibrator.jpg
    28.4 KB · Views: 173
Last edited:
Time

After the postings on price,now it's time for time. Hussle the two and you get targets in time.
Elliot is a bit bullish at the moment, but how long will that continue? In this market with a lot of opening gaps, it's difficult to compose a good elliotcounting. So we will turn to Gann. There's an old dutch saying: what Gann can, can Gann alone.(free translation).
To minimize the amount of words look at the picture.
Have a nice weekend,
Pacito

2 we need some time to fulfill all 5 waves of Elliot
3 why would the top to top be different.
 

Attachments

  • aextrendchange.jpg
    aextrendchange.jpg
    401.9 KB · Views: 176
  • 1.jpg
    1.jpg
    283 KB · Views: 153
  • 1.1.jpg
    1.1.jpg
    239.9 KB · Views: 171
Last edited:
Week 17.

Friday’s remark that I closed all my MLT positions generated some questions so I better explain the nuance. Like most investors I make differences between types of investments by the factor time horizon like Long Term, Medium Long Term, Short Term, Intraday Trading and Scalping. However the actual boundaries are based on the combination of both price and time utilizing different techniques combined into a K.I.S.S. system called KVKD trending area’s. These systems I also use to monitor my investments performance where the objective is to outperform the maximum swings within.
The traders almanac rule number 1 tells you to buy low and to sell high so given some observations ; the MLT KVKD system indicated a relatively high ; the shopping list has been completed ; the actual MLT ride was nice index points wise ; the precise bottom and top do not have to be scored to the index point ; up to the next one.

The Elliott Wave Analysis outlook has not been changed and remains positive on all six used wave labels. The lower wave label indicates in the overall picture that a corrective wave 4 is due hereafter next target 540-548. For this weeks trading the pivot 523,75 will be used to start with. Attached projections are the weekly range and the daily range, the last one I have fine-tuned so it reflects better the actual index position and the range is more in line with this weeks trading.

Have fun trading to WIN.
 

Attachments

  • aaa.jpg
    aaa.jpg
    82.6 KB · Views: 237
  • aaa1.jpg
    aaa1.jpg
    128.5 KB · Views: 250
ik verveel me zo

EDIT: Hey, my friend the trend! Shorts closed, longs open
 

Attachments

  • aex20070424.gif
    aex20070424.gif
    14.9 KB · Views: 165
  • aex20070424II.gif
    aex20070424II.gif
    16.6 KB · Views: 174
Last edited:
Dear Clown,

I have polished my code of 2 the DeMark Indicators "DeMarker" and "TDREI". In de lower window of the picture you see in the upper part the DeMarker indicator in and the lower part the spikes of the TDREI. These indicators are set to default values (I know ...). The theory of the DeMarker says to sell when it moves downward through the 0.7 line and to buy when it moves upward through the 0.3 line. According to TDREI sell a red spike and buy a green spike. I have put a green line in the price window when the DeMarker gives a buy signal and a red line when the TDREI gives a sell signal. Other signals are ignored, because I think they are not very interesting. As you can see the buy signals are pretty good for MLT investment, only those at end of may 2006 and begin of march 2007 are wrong (a buy level of 0.4 might do the trick). The sell signals are to frequent from a MLT perspective, but maybe some filtering or other settings might do the job.

GRS.
 

Attachments

  • aexdemark.gif
    aexdemark.gif
    40.8 KB · Views: 197
Woensdag 25 april

The for week 17 identified corrective wave scenario seems to have some effect on the AEX as our intraday dynamic trending indicator immediately swapped to negatively trending. Since that change the range fractals gradually moved downwards and with a little help from the more sophisticated indicators the acceleration on Tuesday was captured in it’s full glory. The current intraday range fractal is negatively trending and on Wednesday 9-10u 531,73 <AEX< 535,92 so given the trending modus the resistance levels are the relevant ones.

The daily chart has found the support right in the middle of the KVKD trending area system and the make or brake situation does apply to this chart. Note that from the New School signaling point of view the potential has not been utilized so follow the intraday trending modus carefully. From a trending point of view the short term dynamic fractal is trending positively EOD at 530,59 <AEX< 540.98 so in this chart the support levels are the relevant ones to watch.

Have fun trading to WIN.


EDIT:
@ Rentenier,
Beta version 1.00 just a go at some sequential stuff.
 

Attachments

  • aaa.jpg
    aaa.jpg
    128.3 KB · Views: 239
  • aaa.jpg
    aaa.jpg
    228.1 KB · Views: 237
Last edited:
Lekker weertje hoor

Dear Mr Rentenier,

Here is your TdM stuff for the DJIA. I have to say I am not yet fully up to speed and am looking to improve some of the phases or more specifically the phase relationships. Did read some interesting articles on the psychology of investors in a market that is demonstrating multi year high’s or even all time high’s. When I recall the psychology of investors in the different Elliott wave phases it all adds up.

Have fun.

@ Blinker, here is your AEX EOD fractal range for today trending positively in it.


EDIT:
Let’s do a trading set-up to find some money.
The EOD chart is positively trending in the range fractal I provided this morning. The EOD chart bares a Technical Analysis New School Signal called Positive Reversal with target 540,29. The intraday short term chart is positively trending and the bottom you will find in the chart as the green line, please note that this is a dynamic value that moves based on both price and time. This morning the AEX has found the 516,05 1x3 threshold (the upper yellow dotted line) to turn intraday on and what we would be looking for ideally is a turn on the 1x3 523,75 1x3 support combined with the green line.
You know a trader is as good as his next trade so I have given you my potential next trade even when the present one still runs. Especially for the hobby freaks. LOL

chart4.
@rentenier,
This is the TdM signalling part I am not comfortable with (since it is conflicting with my existing money making systems) and probably will have to change a bit since it is lacking essential trading info.

EDIT:
So this is what people mean when they tell you to let your profits run. The intraday short term trending modus has changed into negatively just follow it and take the next one. These types of scenario’s just simply can’t be pictured in full color in advance the reason why I do emphasize you will have to read and practice the involved techniques. Given the changed trend to relevant level to watch also changes accordingly.
 

Attachments

  • aaa.jpg
    aaa.jpg
    175.1 KB · Views: 217
  • aaa.jpg
    aaa.jpg
    38 KB · Views: 203
  • aaa.jpg
    aaa.jpg
    110.7 KB · Views: 226
  • aaa.jpg
    aaa.jpg
    116.5 KB · Views: 205
  • aaa.jpg
    aaa.jpg
    135.2 KB · Views: 183
Last edited:
This morning it looked like a breakout according to DeMark (target around 543). I am not sure if it is still valid, as the breakout line was crossed. Just wait and see what will happen next.

NOTE: The picture is missing some data at the start of the day. It is only a rough estimate, for a perfect picture consult your own data.

EDIT: friend has gone home, exit longs
 

Attachments

  • aex20070426.gif
    aex20070426.gif
    20.4 KB · Views: 169
Last edited:
Top