You are using an out of date browser. It may not display this or other websites correctly.
You should upgrade or use an alternative browser.
You should upgrade or use an alternative browser.
Bonsai
I appologise if you may have already posted this but if you don't mind explaining what exactly do you use to select you entry and exits points.
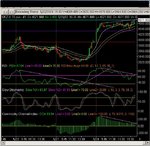
I currently trade from a 1 ,3 & 5 min chart with Bollinger Bands to help with reversals, 2 SMA and 34 SMA on 1 &3m with 13 SMA on 5m charts and then 14 CCI with 7 RSI.
I apply intraday patterns such as flags, wedges and triangles and the more obvious double tops/bottoms together with price and sma pivots and trendlines.
Happy to take repeated small gains rather than stay for the full ride, rather rejoin for another bite of the cherry however l like you idea of topping up although I tend to do it the other way round go in with double and lock in small profit allowing remaining half to run to 20 -30 points when on offer.
Kevin
I appologise if you may have already posted this but if you don't mind explaining what exactly do you use to select you entry and exits points.
I currently trade from a 1 ,3 & 5 min chart with Bollinger Bands to help with reversals, 2 SMA and 34 SMA on 1 &3m with 13 SMA on 5m charts and then 14 CCI with 7 RSI.
I apply intraday patterns such as flags, wedges and triangles and the more obvious double tops/bottoms together with price and sma pivots and trendlines.
Happy to take repeated small gains rather than stay for the full ride, rather rejoin for another bite of the cherry however l like you idea of topping up although I tend to do it the other way round go in with double and lock in small profit allowing remaining half to run to 20 -30 points when on offer.
Kevin
kevin
umpphh
where to begin
all my charts are in spreadsheets with dde links, so I have control over the calcs.
1) realtime feed at the front end with a 2 minute filter.
2) 1hr,3hr,1day,3day sma's
3) Smoothed 1 day rsi using 3hr average.
4) 1hr/1day macd
5) Fib gradients,especially 180 & 360
6) 30 min candles
7) 1min range to detect gaps.
8) standard fibs at 50 and 61.8
thats the basic set up for ftse.
so its a very bespoke system I have developed over the years.
I doubt you could replicate it using web software, in fact I am sure you cant. But because I have the tick data on my computer I have been able to experiment/back test which indicators work best for ME in MOST market circumstances over an extended period
Entry and Exits.
this really is too complicated to set out using this media.
In words, it would take a number of chapters in a book.
But I have a choice using any of the above, sometimes in conjunction with a second.
Like this afternoon. my macd fell to zero just as the index hit my 1 day average and then turned up so I got in at 46.
But start with John Piper's low risk entry signals and that will
explain a lot. His book is 'The Way to Trade'
Last edited:
Bonsai
Thanks for taking the time to reply. While I obviously do not understand your system without viewing some of the data on charts I can see that you are applying a wide range of applications to establish your trades.
When your Macd was providing you with a signal I had an RSI/CCI reversal with the price returning inside the lower band on my 1m chart. The important thing is to use what you are comfortable with it may not suit everyone but its you that counts and like me it sounds like you have put a great deal of effort into getting where you are now.
I have not heard of John Pipers before but will look it up as I am always open to new ideas and it will no doubt be an interesting read. I find if you are to be any good at this game you need to have a passion for it.
Regards
Kevin
bonsai.
From 3910 on 20/5 using abc I estimate a target of 4080 this is 1.5 the ab move.Shouldn't you be looking to go short and not long at 4065.
Reason I ask is I made the mistake of going short SB on 27/5,went out for the day and and you know the rest.
From 3910 on 20/5 using abc I estimate a target of 4080 this is 1.5 the ab move.Shouldn't you be looking to go short and not long at 4065.
Reason I ask is I made the mistake of going short SB on 27/5,went out for the day and and you know the rest.
Similar threads
- Replies
- 808
- Views
- 106K
- Replies
- 866
- Views
- 118K
- Replies
- 478
- Views
- 74K
- Replies
- 197
- Views
- 35K