FTSE 100 intraday trading - JUNE 2003

Jon & Lambchops

Re SMA and EMA you have stated them correctly, 2 close to the price good for reversal, 34 EMA lagging price better for trend analysis.

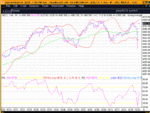
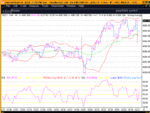
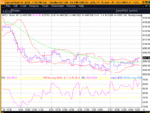
No problem. I had time on my hands today, still in holiday mode and the market was'nt being very dynamic this afternoon. Along my trading journey many have provided me with advice and so it is only fitting that I offer some of my own because without others experience and guidance I doubt I would have got this far and persevered for so long. I still like to look at new ideas and possible alternative strategies but when you have one that works it is best not to change it so I only consider different strategies for now. The only thing I might add is to take an early position against the trend (before trend line change) if I have a good divergence (CCI speak - or Failure Swing RSI speak) but from a 5 min chart (nothing less) and following a good long trend or price range. There were a couple on the 5 min chart I posted today and it is something I have used before. My reservation is that I like to remain with a trend following strategy and do not want to start hunting false signals so I will have to set certain filters such as those I have already mentioned.

If you are going to trade just the trend changes then the system is simplicity itself and you will have no problem apart from when to take the best profit. Obviously waiting for confirmation of the trend breaking you deal will mean you miss out on some of the gains but at the very least it gives you a clear signal to close. I would look to something that suits you for your exit before trend change, either an indicator you are comfortable with or a set target being satisfied with a percentage of the available gains rather than all of them.

However if you are going to use both methods and trade the smaller moves within the trend then you will need to be more precise when you close. I do reasonably well taking 5 points (often taking 5 points means your done and dusted and ready for the next one) or waiting for 2 movements from the SMA starting at the point of trend change. As the trend continues be aware of the danger of entering near the end of the trend, this is where the combination of bands and RSI can help, where a divergence or failure swing is developing. If SB I would not play the moves within the trends and beware of a non trending market, this is where small points become essential or moving to a longer frame chart.


Good luck and go easy until you have given it a bit of a test. While it works well for me it may prove not to be your cup of tea but all the best. Its about 3 yrs in the making so its had a lot of testing and like you I just needed to get it all together I call it my complete strategy because it allows me to play virtually all the price moves in a day. Along the way I have forsaken 3,4,5,10,13,20,30 SMA's, MACD, MACD Histogram, Stochastics (although they work really well with RSI) Money Flow Index, CCI, On Balance Volume and a few others. Keep an eye out for flags, wedges double tops and bottoms and triangles all popular with the FTSE intraday. There are other patterns but I stick to the common easy one's, when I started I said this system was based on simplification but you can add other things as you see fit it all depends what is best for your own individual trading style.


Kevin
 
Kevin - This stuff wants putting together on its own thread. It will benefit a lot of people (first steps) but come July nobody will ever bother to look on this thread and it will be lost. You have spent a lot of time both developing your method and writing this for us and it would be a shame to lose it.
 
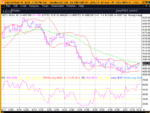
KEVIN: I endorse what other members have already said about your good posts. It takes a genourous and confident personality to share with others.It also takes guts. I salute you. My method is similar with the addition of support & resistance lines to establish swing trades. Using yesterdays High and Lows and the previous 4 days Highs and lows. I have found greater consistency which allows less intraday trades but gives me confidence to increase my stakes when ther following condition is met. In your example charts when the 34 sma on the 5 min chart is moving in the same direction as in the 2 min chart. ( actually I use 5min and 1 min charts) Both smas must be trending. I would not enter(if I did it would be with low stake levels) as the sma has levelled out on your 5 min chart at 1240 thru to 15 10. I would assume a trading range is developing. Similarly at 1610 on your 2 Min chart. Of course if the trading range is wide enough after deduction of stake money it can still be tradeable. Hope you dont mind me adding to your excellent trading plan. Good luck. P.S. I use the above on the DAX
 
Jon & Lambchops

Because you have mentioned that you may use my approach I felt I should add a couple of things to consider and expand on the system. First if all you are going to do is trade the trend changes then you need no further explanation; although some information on pivots may be of help just to understand what is going on before the trend line breach appears.

If you intend to trade within the trends then a sound understanding of pivots is essential because you are applying this sequence to the 2 SMA. If you wish to apply it to the price then only do so with the strong trend and remember that I tend to rely on the SMA pivot or in a continuing price trend the break of the closing bar position, ideally from several bars. (You will see this more clearly on the 5 or 3 min chart, the 2 min tends to stutter a little), I take this precaution as a filter to the price action producing whipsaws but in a strong trend and in the earlier stages of a good trend you may find that you can react to the first move by the price.

One example to help with this feature would be the position of the 34 EMA. If this has a nice slope to it because the price has moved away from the line then it tends to suggest a strong trend is in play, in fact this is what I touched on before when I mentioned SMA traders and the 13 SMA. Basically they would use an SMA to establish the long or mid term trend on a daily chart, having established which trend they were after they would apply the 13 SMA to the intraday chart. The 5 min was a popular time frame but not essential, and each time the price moved in accordance with the SMA they would treat this as an entry signal. It is quite good but does not in my opinion provide a complete daytrading approach as it misses the reversals, but as a system goes providing as in all strategies you stick to the rules it wins out more than it loses and has a good return rate.

Anyway I recommend you have a look at www.snapdragon.co.uk, select the 'Tricks of the trade seminar'. Its is an interesting read and explains what is actually going on in the market when the pivots are being created. I have produced attachments for the main pivots to illustrate up and downtrends (you will note in 3 of the examples all I have done is reverse them however I have reproduced Snapdragons N0 4 by turning it upside down but also around as well).

If you trade this system you will become an expert of pivot formations and a tip that I can give you concerning the FTSE is that number 3 (Snapdragons N0 3) appears a lot of the time when the US markets is in the first 30 mins or so. In fact if you go back to yesterday's chart you will see a good example of this where the lower price is tested pulling the price outside of the previous range appearing to start a new down (or uptrend) only for the price to quickly pull back to the original range and then gain strength to push on and outside the old range in the opposite direction. As I said this is explained in the notes from the seminar.

The other feature that I touched on briefly yesterday was the RSI and failure swings for a reversal position. I know I said this system concentrates on placing trades only in line with the current trend and this still holds good. I have recently been concentrating on CCI as my main lower indicator and so my focus has not been on RSI and therefore my concentration with CCI not working as well as I would have hoped for I have tended to focus on a system that only trades in line with a trend, with the lower indicator being used as confirmation and exit points rather than entry. However earlier in my trading I did use RSI to very good effect and now see no reason why this should not be added to the system with certain filters. My set-up general set-up will be seen as delayed when you compare it against other systems or separate indicators. I feel that with certain conditions YOU CAN ADD 2 ADDITIONAL ENTRY SIGNALS from the RSI for early entry to reversals especially if they are also in line with the trend or main daily trend. They will get you in before the SMA , closing bar sequence or the trend line change.

I would only advise using a ' Failure Swing' (Divergence) on the 5 min chart, I find lower time frames can produce to many signals and sometimes do not produce the results, maybe after more testing you could move down to a 3 min setting but the 5 min time frame appears to act as a filter in its own right. The other signal is only consider RSI extremes, if you look at my 5 min chart from yesterday the RSI was plotted close to or below the 30 setting 3 times and close to or above the 70 setting twice.

Backing up these signals with further confirmation is the price position in relation to the bands, most of the day the price did not venture out of the bands by more than a couple of points yet the best results from the RSI signal came when the price broke outside of the bands by 7 points. Each of the RSI signals generated a minimum of 4 points on the Futures prices, so 4 x 5 = 20 points and that was the minimum available gain from these signals. This of course does not account for all the other signals that were generated throughout the day from trend changes and SMA pivots this is why I like it because there are enough signals during the session to ensure you do not have to wait to long for some action and so you can select when you wish to trade according to your lifestyle.

If you apply this to the 2 min chart then the signals go up to 7 and from memory 1 or 2 of these may not have worked out. From my experience I would consider a setting of under 35 and above 65 as a possible deal and on or past 30 or 70 on a 5 min chart as a confirmed deal when the price then starts to move in the direction you are waiting for. You will need to test the different levels for shorter time frame charts. I just find that in some cases the 2 min chart would produce a failure swing to early or it would only produce a price reaction of about 3 points which does not give you much room to profit from.

When following the RSI Bands combination signal in these circumstances the other signals from the SMA or the trend line change become confirmation of the RSI signal. Of course if you are happy with a different lower indicator then you could adopt the same process as I have with the RSI. I just find the RSI easy to follow.

Right I think that covers it all.
 

Attachments

  • pivot 1 - uptrends.gif
    pivot 1 - uptrends.gif
    5.1 KB · Views: 324
Hi ZigZag

Thanks for your comments and your views. I can understand taking note of the support and resistence levels especially as the floor does not have a computer to work from but are very aware of the previous high, low, close and open and it is not surprising that these levels do get tested. In fact this is something I might consider if I were to position trade holding for a few days to a month, although the set-up I have put together appears to work on any time-frame which is interesting. I have not tested it fully but have had the odd small dabble and its worked out rather well so I may not have the need to consider a different approach anyway.LOL What is important is what works for YOU and wat you are comfortable with. As I said in one of my earlier posts I thought CCI was going to be the bread and butter of my trading as it is for many others but in the end I have more confidence with the RSI and as such I am more proficient with it, so why change if its working well stick to it. So while I have posted at some length about my own trading it may not work for someone else.

This is something that I have considered together with Retracement levels and Fibonacci numbers but at the end of the day I want to avoid the system becoming to complex. The other thing I find is that you start following these levels and I have had a tendency to view them as if they are written in stone and when the price does not react to them I got caught out which I felt was unnecessary. Please don't get me, wrong support and resistence is an important factor it was just that I placed to much faith in them and in doing so got into a bad habit of not reacting to them as quickly as I would like for my own trading style.

They are more suited to the trend change trade I make and yes I would agree this approach does reduce your trades and so your costs and your risk by the lower number of times you actually enter the market. However I like to get the best of both systems by trading the trend and within the trend so I place a smaller deal for the trend because I give it a little more scope to develop yet my deals within the trend are controlled with a tight stop loss and generally if the deal is not working within 5 mins I close.

These deals are fast and furious and you will often find that within a couple of mins you are holding a profit and considering closing within 10 min unless I have caught a strong trend and my paper profit has sailed past 5 points without looking back; then I hold on and look for the next exit to appear. Usually these deals produce 2 - 10 points but some do go on to 30 it just depends what happens around the figure 5 for me.

With reference to your comments concerning the SMA/EMA and in particular the EMA as this is the trend analysis. When I was introduced to this particular tool I was advised that in the strategy the chap was using he would not enter a deal if the line was flat as this tended to indicate a narrow price range. You often see this around the lunch period and after hours. It is fair to say that during these situations there is going to be less trending price movements until the line starts to move one way or the other and so it is best to avoid trading during these times.

However, even during narrow price ranges applying the pivot system and or RSI/Band combination with a trend line assessment you can still make deals of 4 or 5 points and often more (lunch time maybe slow but it can offer a few deals if you are patient) but obviously the best times normally to trade are the first few hours in the morning and maybe the last few hours when the US has sorted itself out.

In respect of the 34 EMA it all depends how large the range is, if the range remains constant over a period then the line will appear flat and this will happen if the range is 5 points or 50. Obviously the lower the range the greater risk that your deal will not furnish profit and a high chance that if you get a profit it will not be much so the 2 min example you mentioned I would give a miss but the earlier one on the 5 min chart I would and did play yesterday and took some 5 pointers. I would not attempt it with SB but futures were fine. Just because the EMA line is flat there can still be good deals to be had from pivots and the trend, I do think this illustrates how to much emphasis can be placed on one indicator or style of trading and if this situation appeared outside of a general slow time then I would still consider pivot and direction signals but maybe reduce my target levels and concentrate on the current trend as this could still change during such a period.

Kevin
 
Lambchops (are you anti other meats) LOL

Thanks for your comments and it does make sense to put it on another thread especially as I appear to be hogging the thread at the moment although these pages do not appear to generate as much interest as it used to, in posts anyway. I would not wish to type all this again or put it all together in a more presentable package it was just something I put down and then answered a few questions rather than a structured format.

Kevin
 
Bonsai

Thought you might like to know apparently the Piper book is no longer in print and therefore unavailable unless the local library can get hold of a copy. Amazon still have it displayed but to check for updates so unless it is to be reprinted which I doubt looks like I missed the boat.

As a mater of interest have you used www.elliottwave.com and if so what were you thoughts.

Kevin

Ps To the rest I will stop hogging the page now.
 
Kevin: Thanks for your detailed reply. Im sure you have given food for thought to a lot of people even though they have not posted. Enjoy your weekend you have earned it.
 
Kevin.
I agree with ZigZag,and I have copied all your charts and the complete trading plan you posted.
Thanks again
Best of luck Jon
 
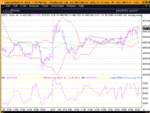
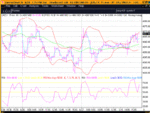
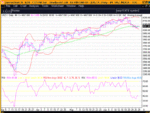
Just to complete the picture finally I have attached charts to illustrate like many set-ups they work on all time frames. I cannot access my Futures charts at the weekend so the charts are taken from one of the cash FTSE index, but close enough.

1m, 3, 10, 15, 30, 60, Daily to follow
 

Attachments

  • ftse 1m.gif
    ftse 1m.gif
    48.1 KB · Views: 512
Daily - its just a matter of adapting to the different time frame in terms of how long you hold and when you take your profit but the SMA pivots, trend lines and failure swings or RSI extremes remain the same. On difference is that the RSI becomes more of a trendline in its own right the longer the time frame used.

Right unless I get a question that really is it now.

Kevin
 

Attachments

  • ftse daily.gif
    ftse daily.gif
    47.5 KB · Views: 464
kevin
EWI is a good site with lots of useful stuff.
Them main exponent of Elliott, who I follow is here.
<a href="http://stockcharts.com/def/servlet/Favorites.CServlet?obj=ID54819">Keller</a>

I wont post the charts because they are to big and for
U.S.A only.
 
Last edited:
Bonsai

Have not had a chance to go through the EWI site in detail but looks good if your interested in the EW approach which I am because it links closely to how I break up the day in trends.

I see what you mean about the 'Keller' charts again I need to go through his report in detail but I like the way it provides examples of intraday positions. All to often when reading up on the nuts and bolts of a particular study they only display it in the conventional form in historic charts rather than getting down to how to apply it in an intraday format. I have saved all the charts and text separately and look forward to a good read.

You previously mentioned the Proctor book on EW, while this will no doubt explain the theory in detail does it also help re Intraday examples.

The US does seem to have much more available to the private investor/trader and over here. Do you know of any site that produces such quality of EW intraday charts on the FTSE as this does appear to be sadly lacking. :LOL: Would you like to have a go here. I mentioned previously that when I am trading because of the strategies I apply I have to remain glued to the screen and therefore cannot take the time out to post here during the session unless I call it a day. A better medium for me to be in contact during the session would be some form of direct chat such as messenger etc without the need to type. In fact are you aware of a site called 'woodies' cannot remember exact web address but this was set up by a well respected US CCI scalper. You have access to chat but the facilitator is the main speaker during trading and is also trading so produces his own charts in real time for you to see and follow and listen to him as he makes his buys and sells. They work from the ES and take just a few points at a time and while it is not my cup of tea, basically as I do not wish to trade in the evening it is a brilliant way to trade and would be great if something like that was available for the FTSE.

Some others do cover the ESTX50 but not the FTSE and it is all about the use of CCI, in fact they become trained in working just from the CCI tool without reference to the price, thats the idea anyway.

Kevin
 
Top