FTSE 100 intraday trading - JULY 2003

bonsai

Veteren member
Messages
4,106
Likes
11
FTSE 100 Intraday trading - JULY

....................................JULY STARTS HERE ..........................................[img src="http://www.proudtobebritish.co.uk/ptbb/intropics/uk.gif"]

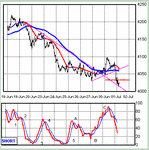
<img src="http://chart.neural.com/servlet/GIFChart?sym1=ls:ukx&cbcku=FFFFFF&cbckl=EBF5FF&cbckd=cccc99&ctxtu=000000&ctxtd=000000&ctxtl=000000&csym1=000099&csym3=000000&cbckg=FFFFFF&cind7a=FF0033&cind7=009900&cind8=blu&cind9=6666CC&avg1=55&avg2=510&ind7=macd&periodMACDLow=510&periodMACDHigh=60&height=350&width=450&source=SP&multipane=1&watermark=splogoblue.gif&dres=min&plottype=range&ignore=1220025226&dperiod=days&coname=1&image=PNG"></img>
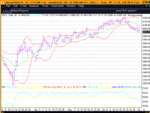
<img src="http://cchart.finance.ukl.yahoo.com/z?s=^ftse&a=v&p=m100,m50&t=5d&l=on&z=l&q=c&i=uk">
 
Last edited:
<font color="blue" size="4"><br />
<marquee direction="right" behavior="alternate">HELLO, GOOD MORNING & WELCOME</marquee><br />

S&P 500 Futures on Globex = After the Close <br />
<img width ="500" height="400" src="http://money.cnn.com/markets/morning_call/globex.png">

USEFUL LINKS FOR YOU</b> <br />
</font><br />
<a href='http://www.investtech.com/subscr/uk/' target='window'><IMG SRC="http://web.onetel.net.uk/~gawgaw/charts/invest.gif"></a><FONT COLOR="#cfd7df">.<a href='http://www.timesonline.co.uk/section/0,,5,00.html' target='window'><IMG SRC="http://web.onetel.net.uk/~gawgaw/charts/times.gif"></a>.<a href='http://cbs.marketwatch.com/news/default.asp?siteid=mktw' target='window'><IMG SRC="http://web.onetel.net.uk/~gawgaw/charts/cbs.gif"></a><a href='http://news.ft.com/markets' target='window'><FONT COLOR="#cfd7df">.<IMG SRC="http://web.onetel.net.uk/~gawgaw/charts/ft.gif"></a><FONT COLOR="#cfd7df">.<a href='http://finance.lycos.com/home/livecharts/default.asp?symbols=INDEX:INDU' target='window'><IMG SRC="http://web.onetel.net.uk/~gawgaw/charts/lycos.gif"></a>.<a href='http://www.signalwatch.com/signalwatch.asp' target='window'><IMG SRC="http://homepage.ntlworld.com/thomas.mcphillips/DS.gif"></a>.<a href='http://www.raptorgroupresearch.com/' target='window'><FONT COLOR="#cfd7df"><IMG SRC="http://web.onetel.net.uk/~gawgaw/charts/raptor.gif"></a><br />
<br />
<a href="http://investor.stockpoint.com/quote.asp?Exchange=&Mode=CHART&Symbol=LS:UKX" target='window'><img src="http://web.onetel.net.uk/~gawgaw/charts/er2.gif"></a></font></p>
 
Last edited:
At least on July 1st, we are higher than we were on January 1st !

But only just. It seems to me the buy and hold strategies leave a
lot to be desired ?
 
I notice there seems to be a gap up around 4052/8.

Ftse likes to fill its gaps.
 
Morning chaps & chapesses,

Hi Kev,

Ain't seen Surfspike on my surfing. Do you miss the fish tank? LOL


Aisian markets seriously =ive last night.

Dow at the bottom of it's current upward channel .

New month.

Could be a +ive move Northwards- (kind of flys in the face of Sunseekers' 4th July predictions) whose views I respect immensely. Ok three days- will do. All IMHO
 
Heh Bonsai,

Never mind the helpfulsites. Where did you get the eye candy adorning the boxes ?? LOL
 
lockstock
just for you, I have added another bit of eye candy ?

LOL
 
2 if possible
1 bounce off trend line from 4200
2 break of 1 hr ma

or change of trend in Winners/Losers Line
or fib level
or bounce on gain line
etc

this bounce looks a bit suspect.
 
...agreed, I'm looking for 1 more higher low on the RSI and will see if that looks more promising. Thanks for your reply.
 
don't use the rsi you get on charts. seems too ambiguous for me.
I have my own version which works much better.
But you have to have a real time spreadsheet to do the calcs.
It involves working off the averages to calc the ups/downs.
Very very smooth and tops and bottoms very well on ftse.
I'll post a picture if I get time later on.
 
looks like the sb's smell a rally ?
want to make it expensive to enter ?
 
Chow
here is the pic.
since I snapped it, rsi is now lower and in oversold territory
so the trigger is cocked !
 

Attachments

  • rsi.gif
    rsi.gif
    8.8 KB · Views: 1,230
Last edited:
Thanks for the insight, much appreciated - intraday chart forming a nice triangle now, shouldn't be too long b4 she blows.
 
There's a wonderfull thread in Techies Corner -- 'LCD SCREENS' anyone like to contribute?
 
Well the FTSE has dipped its foot in the water below 4000 today, and is testing the lower channel of this last rise from 3300.

The question, is this a retracement of this rise before it gets another attempt up, OR is it a continuation of the downtrend with this last rise just being a correction of the previous fall.

I don't know is my answer maybe someone with knowledge of EW can assist, for my part what I can mention is that at the very least it will produce a retracement and on that basis a rise of approx 900 points would produce approx point reversals of 30% = 270 or around 3930, 50% = 450 or around 3750 or a conservative 60% (because the upper level is said to be between 62 - 66% but 60 is easier,LOL) = 540 or around 3660.

The % are conservative f you wont to be more precise then there are also the Fibonacci retracements which are slightly different to the basic retracement theory 0f 33%, 50% and 66%, Fibonacci figures (if my memory serves me correctly) are 38%, 50% and 62%. Often when the upper level is breached ten it can be in the 80% region and obviously if strong support then 10 - 20%. Although we have not yet had a confirmation with a closing figure below 4000 the intraday moves are already around a 25% retracement.

The move from 3300 to 4200 must be a wave so can anyone shed some light on this for possible future analysis

Kevin
 

Attachments

  • ftse daily 01 jul 03.gif
    ftse daily 01 jul 03.gif
    47.1 KB · Views: 1,257
Top