You are using an out of date browser. It may not display this or other websites correctly.
You should upgrade or use an alternative browser.
You should upgrade or use an alternative browser.
tradesmart
Experienced member
- Messages
- 1,286
- Likes
- 22
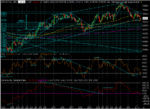
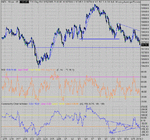
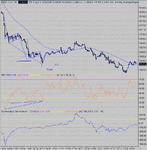
The Dow has clearly reached a critical juncture imho....
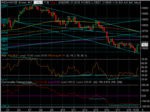
The obvious Head and Shoulders setup could deliver a 200 point fall to 10575 ish, but support could be forming at the lower trendline from the 10400 lows and a PD bottom forming on RSI could indicate the start of a ‘W’ and another wave up within the rising channel…
Candles and lines on a chart can only hint at possible price scenarios; the news this week will determine direction…
The OPEC meeting on Wednesday could produce a hint of increased output to calm the burgeoning price of oil and the fixed income market, but the current account data released on the same day has been identified as a potential “catastrophe” for the stock market…..
Take your pick…… 😕
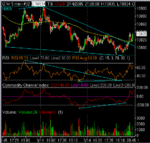
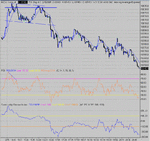
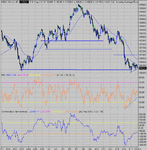
edit – Jun Futs 5min chart added - another falling wedge triangle as a result of the price action over the last three sessions, culminating in a break to the upside tonite – the notional target is c.10900 imho (knock 30ish off to get the cash value….)
Attachments
Last edited:
tradesmart
Experienced member
- Messages
- 1,286
- Likes
- 22
Wonder what happened to Friday
Quadruple Witching this coming Friday - broomsticks at the ready.....!...... 😉
blackcab
Established member
- Messages
- 523
- Likes
- 51
I hardly get any time to learn and practice, but I looked last night at 9pm and it seemed to me a perfect case of repeated lower highs/lower lows, bumping down nicely. Did anyone here trade it purely on that simple basis - "trade what you see"?
God I wish I were doing this for a living instead of wage slaving 🙂
God I wish I were doing this for a living instead of wage slaving 🙂
tradesmart
Experienced member
- Messages
- 1,286
- Likes
- 22
Yes, a sure symptom of descent, and short entries could have been taken at the tops of the lower highs with some confidence...RSI was very weak...it seemed to me a perfect case of repeated lower highs/lower lows
But, just when the bears are sharpening their claws at the H&S prospects and having noted the trendline break; yet another falling wedge triangle appears, and often they break to the upside…….
We’re also in the vicinity of the 38.2% retracement of the big move up which can give support..
The futs are up 25ish on last nights close, and if the data at 13.30 is half decent, maybe the exchange MM’s might be tempted to organise a flash rally to take out some short stops…
Pure speculation for now, but that’s the way they often do it….
(And then when everyone is completely disorientated – the right shoulder performs with a vengeance.. :cheesy: )
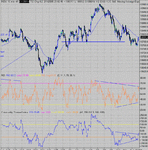
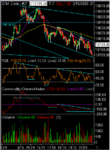
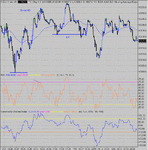
edit - 3min chart attached - can lower highs/lower lows = small bull flag...?
later - General Motors (GM) lowered its earnings outlook for the first quarter and full year Wednesday to reflect weak sales and production volumes in North America...
And the futs tank 40 points......moving target or what.....?... 😱
Attachments
Last edited:
rav700
Senior member
- Messages
- 2,170
- Likes
- 71
Quadruple Witching please explaing the effects on the market for tommorows
the effects on the market for tommorow as I trade binaries on the dow jonestradesmart said:Quadruple Witching this coming Friday - broomsticks at the ready.....!...... 😉
rav700
Senior member
- Messages
- 2,170
- Likes
- 71
thank you very much for your help frugi
So basically stay away from the market tommorow I guess rightfrugi said:There is usually above average volatility on this once per quarter event. Often a sharp move in one direction then an equally sharp reversal in the other. Up then down tomorrow? Who knows? Be careful out there either way.
tradesmart
Experienced member
- Messages
- 1,286
- Likes
- 22
Am I seeing double......?!...... 😱
Must be the Benedictine......
(if it's good enough for a trading guru, it's good enough for me....... 😉 )
Must be the Benedictine......
(if it's good enough for a trading guru, it's good enough for me....... 😉 )
frugi
1
- Messages
- 1,843
- Likes
- 133
Small Woolly Clanger said:There is usually above average volatility on this once per quarter event. Often a sharp move in one direction then an equally sharp reversal in the other. Up then down tomorrow? Who knows? Be careful out there either way.
Oh okay then - down then up 🙂 Don't you just love those option writers LOL
Gap fill next around the 10770s (Jun) next week or am I being wildly optimistic?
Computer says no ... (as in yes it will)
tradesmart
Experienced member
- Messages
- 1,286
- Likes
- 22
Gap fill next around the 10770s (Jun) next week or am I being wildly optimistic?
Computer says no ... (as in yes it will)
Computer says yes........!!!!!!!
(Take it from head Bull.......... 😎 )
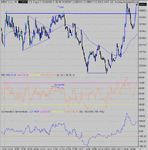
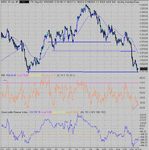
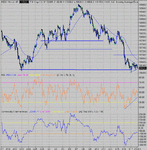
ps - the price action today corroborated the lower downtrend channel line.....
top channel line at 750ish corresponds with gap fill level.........
will it become a big bull flag......?......time will tell....
Attachments
Last edited:
Similar threads
- Replies
- 1
- Views
- 2K

