Dow Intraday Charts 08 Dec - 12 Dec

Thanks RR and TS - all very useful. Actually reduced my position size about a month ago after a post from CM - yet again! Also happy with taking losses as part of the plan. Strangely enough this does feel like "good" trading!
I'm surprised that I feel little emotion with a situation like this - the only downside is a sense of frustration, which has been compounded by the SB bias. This is about to change as I now have a funded IB account, with all the green lights!
Cheers All
Q
 
Q - I have recently suffered the same fate... A lot of success in trading is about confidence (IMO) - once that is lost it makes loosing even easier :confused:

I managed to get my confidence back & start winning by taking a break - but mine wasn't in the Cook Islands - unfortunately!

Sorry for the dumb question - but what is IB?
 
SFX - they're the Direct Access brokerage that a lot of people on these BB's use. You can visit them at interactivebrokers.com
Q
 
Look I'm probably not the one to ask about that, but take a look at the threads under brokers, and also go to the review sections. There are many more people here who can answer your queries I'm sure.
Q
 
SFX

1 pointspread when you trade the $5 Dow e-mini future ( approx £3 per point spread betting ).

Only down side is that you pay tax on profits ( if you tell the tax man ;) ;) ;) )
 
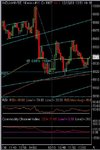
I'm seeing todays action as a big bear flag with a sub-9900 target - doesn't look like a launch pad for 10050 to me! :confused:

always ready to be proved wrong though....... :eek:
 

Attachments

  • dow 10-12-03.jpg
    dow 10-12-03.jpg
    45.6 KB · Views: 282
TS - Agreed, will short if/when 9900 is broken, but will keep tight s/l, probably look to take profit at 9850...

I'm still bullish and think its only a matter of time before 10K is broken....but maybe not a soon as I expected :eek:

Are you still short from 10k yesterday or did you close that trade?
 
SFX - I'm still running the short from 10k ish and have added today at 9955 - will close part today - greed is the enemy and all that ! :devilish:

We may be in a short term down trend now, though there will be bounces along the way of course.....

Will be interested to see CM's observations on possible new trendlines.

Agree, it's only a matter of time before 10k is attacked again...

The 'Santa' rally is nigh.......... :LOL:
 
damn - left my short open at 9950, put in a stop at 9945, limit buy at 9910 as the price moved in my favour, went home, quite happy to see dow at 9905 - checked and found my stop had been taken out by the little peak :(

Otherwise, would have made up all my losses and more .....

TS - concur with that bear flag - but at close, target failed so myabe that bear is invalid now?

Actually, looking at the even bigger picture, it looks like a bull flag being formed .......
 

Attachments

  • image4.jpg
    image4.jpg
    45.3 KB · Views: 479
Last edited:
Chaps,

Been mulling over todays action and think I just clicked - apologies if this is a bit obvious

Remember, earlier today I mentioned that I thought I saw a descending tri on the 10 min chart? Well, lookig at it again, it's still there and the break from it makes sense.

So, if we had been trading it on the 1 min chart, then we would have been longing around 9920 and shorting between 9960 & 9940. The final leg down would have led to the triangle break - nice.

So, I think the idea here is to daytrade the bigger TA picture if there is one and u catch it early on.

Whaddaya reckon - too obvious?
 
Had quite a profitable one today :) :)

On range bound days like today I find good opportunities in trading breaks of the 50 SMA on a 1 minite chart ( sorry can't post as not sure how ) also backed up by some analysis to confirm tops and bottoms.

The first 3 breaks today all provided 20 point + results on very clean breaks of the 50 SMA , the other two trades has to be worked a little harder for but produced results at 17:30 ( c10 pts )and 19:20 ( c 30 points).

If the range is too narrow no clear signals are provided but if we are bouncing around 30 points like today, clear low risk signals are given more often than not.


I only traded 4 out of 5 and lost around 20 pts on early volatility.

Roll on another range bound day tommorrow please :D :D :D
 
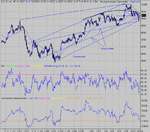
The 10 min is a mess. I've drawn on two possibilities. Take you pick. There may also be a rounded top ( a new one) but it doesn't really fit past profiles.- I'll still draw it in as it will be a reminder of where the SR curve is.....
I see a bull flag over that last few day that has to resolve tomorrow IF it is going to deliver.Looks like 9932 wil be about the mark.The failure will be obvious, with next support down at 9850.The bull target I have around 10,080. I just wish I could extrapolate the upper trend lines out to a time/price point......
ES close looks very strong from a bull point. Will need to check the overnight action in the morning to see how things have developed.
On those trend lines.... a point for thought/debate... is it right/wrong/better/worse to ignore the spikes that lie outside of a best fit?
 

Attachments

  • dow 10-12-03 10.gif
    dow 10-12-03 10.gif
    40.1 KB · Views: 491
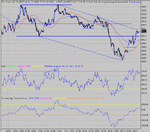
Interesting vol on ES today. First , the bottom at 9915 on DOW was not confirmed by divergent vol on ES. The double top at 9957 was, with a lower vol on ES on the second peak.
Yes, the "W" didn't perform...The third peak at 9950 sort of confirmed that.
The ND top was a nice out and with a clear lowr high on ES, along with that vol divergence, should have been enough to promt a short...Now the out.... the down move had RSI ratio at just under 1:1 but the up move towards 32 was very weak. In the end it was a hard call as the price tested 32 and then broke through....I don't have the answer to that one. :(
The correct trade would have been to cover at the triple bottom at 25 and go long at the 32 pullback at 18:56.OK so the cover at 25 was correct, but the long at 32 was a failed trade. Obvious in hindsight. Correct at the time ( as far as I can see).
I've put the 50 SMA on ( red) so you can see how it panned out.
Anyway, getting the short on for the drop was the order of the day...as the price pulled back to the 100MA after failing 32 again. Not easy and I can see how easy it was to get whipped today.Out on the PD bottom - easy, and confirmed by ES vol. Div.
Inv H&S entry for a long ( interestingly at the 50 SMA break).
Not an easy day at all, especially SB'ing, made worse by not having the fist bottom confirmed by ES vol. Having said that, looking at ES 5 min chart, it is clear there is a "blow off bottom".
 

Attachments

  • dow 10-12-03 1.gif
    dow 10-12-03 1.gif
    28.3 KB · Views: 523
Chartman,

Cheers once again for your unfailing assistance and analysis.

You rightly crave the ability to extend your trendlines into the ether at the RHS of the chart. It looks like you're using Sierra, in which case your wish can be granted, albeit somewhat unsatisfactorily.

I think the chart in question has to be part of a chartbook. I lie, it works with any chart. Press F5 (Chart Settings). Click on Scale. Change to User Defined. Alter the boundaries to suit your extrapolation. Click OK.

Then, either shrink the chart to such a degree that there is only sufficient data to cover a portion of the window.

Or click repeatedly on the arrow at the bottom right hand corner of the chart window. The chart should move slothfully to the left, opening up blank space on the RHS.

Extending trendlines will extend into the blank space, as will text annotations. Normal trendlines refuse to cross the border.

I imagine you've probably tried this, so sorry if I'm stating the obvious.

Cheers.

PS

I've always wondered if your fine soubriquet is pronounced like Superman or Cartman? I have a slight preference for the quietly confident latter, but hey I'm not fussy :cheesy:

Right, off to bed before I think trading 5 lots after hours is a good idea.
 

Attachments

  • dji.gif
    dji.gif
    48.4 KB · Views: 489
Last edited:
Thanks for that Frugi . I did try that once and it was useful, but it's the time scale that's missing which makes time scale estimates difficult. But it's better than nothing I have to admit, I'd forgotten about that feature...... The nick is pronounced Ch as in Charts and not Ch as in Chat ( the French word) :cheesy:
 
9990? 2 points out - shocking :cheesy:

Last push to 210k to complete 3pk div?

Tick/MACD of Tick div on ES. Now waiting for Tick/ES div if there's a new high to short.
 
Top