You are using an out of date browser. It may not display this or other websites correctly.
You should upgrade or use an alternative browser.
You should upgrade or use an alternative browser.
Frugi, I would agree. At least another test of previous highs in ES at near 1073 which see DOW at 10035ish.
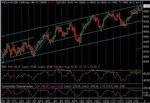
This market still has some umpfh to push higher, but looking at ES, it just feels like strong hands distributing risk to weak hands. Maybe, I am biased but money flow was down in both ES and YM from 14:45 onward. I believe a sign that trading happens at the bid. My Accumul/Distribution chart also displays less strength in the post 19:00 rally.
Perhaps others who know more about these indicators can comment.
For now my target is DOW 10035 & YM H4 at 10k
Nice call Frugi and Bgold. 1072 was the better call with the corresponding DOW at 10,025. Neil suggested an early bull flag, which eventually did turn out to be one although it seemed like having to wait all day for it to turn. 🙁
10K it is, and I make the bull flag target 10.060 and we're a long way off that. Yesterday's big closing volume suggested a move up today and that's what we got.RSI goes in tramlines too, so watch for a 10 min pullback to the 40 line, maybe. If we were that strong, we'd have closed at HOD. Having said that, it was only 12 points off and ES post market is back at 1072.
The rounded top is now definitely cancelled....
Attachments
What an utterly boring day...almost. Highlight was the bounce off 64 for a long to take us over the 10K and an out at 022 at the ND top for a decent amount of points. I missed it, but the expanding triangle seen by Frugi and Bgold provided the key to the breakout. I doesn't seem to me that this has the feel of continuing straight off tomorrow- insufficient volume. The market is not convinced. So I suggest we pullback to 64. But don't bank on it!
Attachments
tradesmart
Experienced member
- Messages
- 1,286
- Likes
- 22
tradesmart
Experienced member
- Messages
- 1,286
- Likes
- 22
Copper – very useful info – thanks
I think that a lot of traders are anticipating a significant pullback imminently, but as usual, timing is everything….
How far they’ll want to take the Santa Rally I don’t know, but certainly 10041 is a number to watch for……will we see it today?!?
I thought it was going to tank 100 just now, but there are still plenty of bulls about….. 😱
tradesmart
Experienced member
- Messages
- 1,286
- Likes
- 22

tradesmart
Experienced member
- Messages
- 1,286
- Likes
- 22
I took a pre-market short at 10035 just on the basis of "it can't stay up here" and covered at 9978 at 15.00gmt (trading by the clock!! 😕 )
I was quite surprised by the way it took off back into the 10k's again and it's obvious that there's a bull/bear battle going on, so now on the sidelines for fear of getting whipsawed.......
Shocking dilemma to be in........ :cheesy:
ps:-anmolway, I see the triangle which looks bullish, but a bit hesitant to take a long at these levels.....
tradesmart
Experienced member
- Messages
- 1,286
- Likes
- 22
I was thinking that the triangle target might be 10055 ish....
is this bull....?!
is this bull....?!